Digital Marketing Solutions Summit | Forum Events Digital Marketing Solutions Summit | Forum Events Digital Marketing Solutions Summit | Forum Events Digital Marketing Solutions Summit | Forum Events Digital Marketing Solutions Summit | Forum Events

Posts Tagged :

Analytics

LEAD GENERATION MONTH: Sales analytics held back by data privacy, poor data and limited cross-functional collaboration

Eighty-four percent of sales leaders agreed that sales analytics has had less influence on sales performance than leadership expected, as indicated by new research.

Gartner surveyed 303 sales leaders in July 2023 to understand the current state of sales analytics and the metrics used to drive insight generation and behavior change within sales functions.

“With analytics comes the expectation of transformative decision making, but the reality is that many organizations struggle to produce actionable insights regarding their most important decisions,” said Kelly Fischbein, Senior Principal, Research in the Gartner Sales Practice.

When asked to identify barriers to analytics success, data privacy concerns or regulations (45% of respondents), poor data quality (44%) and limited cross-functional collaboration (44%) were cited as the top three reasons (see Figure 1).

“The net result is compounding complexity: More uncertainty creates more demand for analytics, which creates demand for more data, which in turn presents analytics teams with challenging operational barriers,” said Fischbein.

Source: Gartner (February 2024)

To address the disconnect regarding sales analytics and influence on sales performance, CSOs must mutually define analytics value proposition with their operations leaders. The Gartner survey went on to find that CSO-led analytics are 2.3 times more likely to achieve higher forecast accuracy than non-CSO led analytics. CSO-led analytics are also 1.8 times more likely to exceed customer acquisition goals than non-CSO led analytics.

“To achieve higher strategic influence of analytics, CSOs must lead when it comes to aligning analytics strategies to sales objectives and communicating insights from analytics,” continued Fischbein.

To achieve this change in behavior, Gartner suggests CSOs:

  • Deploy a decision driven analytics approach to prioritize the analytics that can have the most influence on the decisions that have the greatest impact.
  • Build specialization in their analytics organization that aligns with their top priorities.
  • Analyze seller performance metrics comparatively to drive actionability.

Photo by Amy Hirschi on Unsplash

Marketing analytics are only influencing 53% of decisions

Marketing analytics are responsible for influencing just over half (53%) of marketing decisions, according to a survey by Gartner.

In May and June 2022, Gartner surveyed 377 users of marketing analytics to explore the role of marketing analytics in decision making.

“CMOs often believe that achieving marketing data integration goals will lead to greater influence and increased value of marketing analytics,” said Joseph Enever, Sr. Director Analyst in the Gartner Marketing practice. “The reality is that better data won’t increase marketing analytics’ decision influence alone. CMOs must address the real challenges — cognitive biases and the need for a data-informed culture.”

The survey found that the quantity of marketing decisions that analytics influences does matter: Organizations that report marketing analytics influence fewer than 50% of decisions are more likely to agree that they are unable to prove the value of marketing. Once marketing analytics teams cross that 50% threshold, there are likely diminishing returns to striving to increase the quantity of decisions influenced.

“By 2023, Gartner expects 60% of CMOs will slash the size of their marketing analytics department in half because of failed promised improvements,” said Enever.

Top Barriers to Marketing Analytics’ Influence: Data Quality Challenges and Cognitive Biases

Consumers of marketing analytics continue to cite evergreen data management challenges as the top reason analytics are not used when making decisions. The challenges of “data are inconsistent across sources” and “data are difficult to access” rose to the top in this year’s survey.

Marketing organizations regularly respond to these challenges by integrating more data or acquiring different technology seen as a fix-all approach to marketing data management — yet they fail to realize tangible impacts on key outcomes. For example, marketers experience diminishing marginal returns on data integration when pursuing a 360-degree view of the customer.

Barriers to the use of marketing analytics in decision making are not always caused by data integration challenges unique to marketing — rather, much of this boils down to people and/or process problems.

For instance, key cognitive biases are at the root of marketing analytics’ influence plateau. One-third of respondents reported that decision makers cherry-pick data to try to tell a story that aligns with their preconceived decision or opinion.

In addition, roughly a quarter of respondents said that decision makers do not review the information provided by the marketing analytics team (26%), reject their recommendations (24%), or rely on gut instincts to ultimately make their choice (24%).

CMOs must address these challenges by:

  • Tracking the decisions that are made based on analytics to provide a current state of view and areas to improve. Identify examples of marketing analytics work that provided actionable recommendations to a marketing campaign or program. Marketing leaders should encourage their team to look for patterns in decision-making habits and to document the types of decisions they influence.
  • Combatting cherry-picking. Set KPIs and metrics before launching a new campaign or marketing strategy, not after the data has already started to come in.
  • Encouraging senior leaders to set an example. Avoid being a HiPPO (Highest Paid Person’s Opinion) and actually allow data to inform, or change, decisions.
  • Establish analytics upskilling programs that account for differing workflows and resource constraints across the marketing organization. Build personas that detail how different employees need to use data in their roles and prioritize training sessions that best enable participants to learn the skills they need to perform their job.

Marketing departments ‘rely on outdated data and analytics practices’

The majority of marketing departments still rely on outdated practices when it comes to marketing data and analytics, according to a new report.

Of the almost two-thirds of marketers surveyed by Adverity who believe their company is analytically mature, some 77% have yet to achieve a single unified view of their marketing performance while 68% still depend on spreadsheets for reporting.

At the same time, although 61% of marketing departments see developing predictive analytics as a key strategic aim in 2022, more than a third of those still struggle with manual data integration and some 48% say they do not trust the accuracy of their marketing data.

Conducted by Sirkin Research, the report surveyed almost 1,000 marketers and data analysts from around the world about their current data capabilities and aspirations for 2022.  Alongside businesses’ aspirations for predictive analytics, the research also revealed a worrying disconnect between analysts and marketers when it comes to understanding what their business’s current capabilities are.

For example, 60% of marketing data analysts say their organization already has the capacity to run predictive models, and yet only 42% of marketers agree. Similarly, although the majority (59%) of analysts say their company has a centralized data warehouse, only 43% of marketers say that’s the case.

“While the confidence of marketing departments in their analytical capabilities is commendable, that so many businesses are actually still struggling with the basics tells a very different story,” said Adverity CMO, Harriet Durnford-Smith.

Jeff Sirkin, CEO of Sirkin Research, added: “Yet, it’s the marketers who are actually the ones who should be utilizing those capabilities to make decisions and determine where budget is spent. If they don’t know what their company’s current capabilities are, this not only hinders their effectiveness, it is also a waste of money for the business. As such, bridging this divide should be a top priority for CMOs in 2022.”

The new research comes on the heels of Adverity’s “Marketing Analytics State of Play 2022: Challenges and Priorities” research report, which outlined the pain points facing modern marketers and data analysts–most notably, a lack of trust in the data. This new report builds out further how marketers can reflect on the challenges that they currently face and helps to identify solutions that will provide guidance for how to prioritize modernization in 2022.

Google Analytics Segments Vs Filters

By Ben Johnston – Head of SEO & Data Analytics – ESV Digital

Learn the difference between Google Analytics segments and filters, what they are, how they work and when you would use each of them...

One of the most common questions I’m asked about Google Analytics is the difference between a segment and a filter and the main use case of each of them. I’m often asked why you would ever use a filter when a segment does the same job and vice versa.

In today’s post, I’m going to briefly run you through what segments and filters are, how they work and the reasons for using each of them.

WHAT IS A GOOGLE ANALYTICS SEGMENT?

A segment in Google Analytics lets you view your metrics based upon specific criteria, for example only organic or paid traffic. They allow you to change your data on the fly and you use the whole of the Google Analytics interface just focusing on that data and, crucially, they do not change your data the way a filter does.

A segment can be applied retroactively, so you can see how your organic performance was last year and so on, and you can also create your own segments based on certain specific conditions. You can even share those custom segments with other Google Analytics users.

You can apply a segment to your Google Analytics like so:

Click the Add Segment button and you’ll see the list of pre-configured ones. As you can see, there’s a lot to play with and with the ability to import new segments from the Google Analytics gallery and create your own, there’s plenty of flexibility there to investigate your data from a variety of perspectives.

Segments are great and an essential part of your Google Analytics arsenal, but they’re not without their weaknesses.

Weaknesses Of Segments

As handy as it is being able to alter your data on the fly, there is inherently some lost functionality compared to filters. Firstly, there is less flexibility in what you can do with a segment than a filter – you cannot exclude a specific IP address or series of IP addresses with a segment, for example.

They also have a habit of triggering sampling within Google Analytics, where the data shown in a report is less than 100% accurate. If your dataset is small, you should be OK, but segments do bring this on much sooner.

WHAT IS A GOOGLE ANALYTICS FILTER?

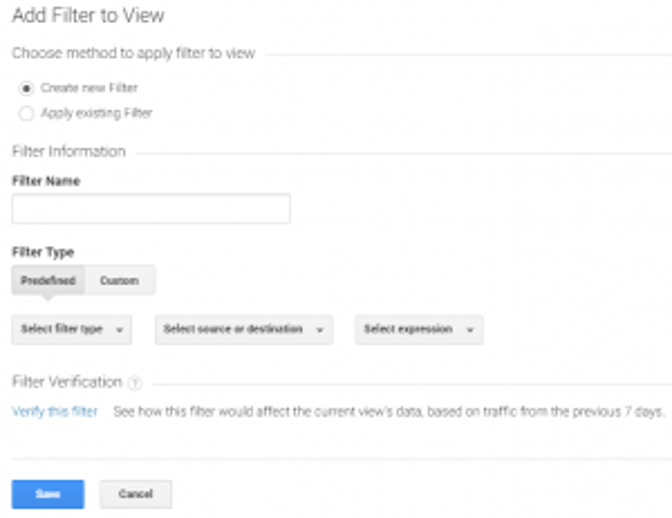
A filter is applied to a Google Analytics view and permanently changes the way that the data is collected for that view, rather than changing the way it’s reported on the fly. Unlike a segment, a filter will not change your data retroactively.

Filters offer a great deal more functionality than segments – as well as just replicating the capacities of segments, which would be prudent if you have a high amount of traffic, you can also make sweeping changes to the way your data is collected, processed and reported. You can use a filter to rewrite the URLs in your page reports, for example, or to double-check the hostname or simply to exclude a section of traffic which you know is not relevant (your own team, for example, or bots). You can also unleash the power of regular expressions to really take control of your data.

Filters are a far more powerful solution than segments, but they don’t offer the same flexibility. You would use a filter for a specific task within a reporting view (excluding your own office’s traffic, for example), rather than using it to check the performance of a specific metric in most cases.

Weaknesses Of Filters

With the power of filters comes responsibility in their use. They permanently change the data in a view from the moment they’re applied to the moment you remove it. There’s no going back. They also can’t be applied retroactively in the same way a segment can. It’s this permanence, plus the additional Google Analytics knowledge required to set up a filter that is the key weakness of them.

In line with best practice, you should always have a completely unfiltered “All Website Data” view, to ensure data continuity and to use for checking that your data is coming through properly. You should then have other filtered views depending on the kind of requirements your site has.

At the very least, we suggest having the All Website Data view and a view which filters out your own IP address and the IP address of any partner agencies/ other offices etc, although we would typically go much deeper than this with a Google Analytics setup.

WHEN TO USE SEGMENTS & FILTERS

A segment is the best way to isolate a certain metric, channel or device in your reporting view and apply that to your historic data. If you want to see how many people have come to your site over the last three years from Facebook on their tablets, a segment is the way to go.

If you need to permanently change the way your data is collected, such as excluding your IP address, removing bots, or rewriting your URLs so that they’re easier to read in reports, you’ll be looking for a filter.

The key thing to understand about filters vs segments is that there is really no “vs” at all. They’re different tools for different tasks and a good setup uses them together. For most reports, you’ll be relying on segments to isolate and highlight different metrics, but to ensure that your data is as clean as it can be, you’re going to need filters to be involved.

Unsure of how well your Google Analytics setup stands up to best practice? Get in touch with ESV Digital and let us see what we can do to help. Follow us on Facebook and Twitter for the latest updates.

GUEST BLOG: The Evolution of Business Intelligence Trends

By Naveen Miglani, CEO and Co-Founder at SplashBI

In recent years, the world of Business Intelligence (BI) has been turned upside down. Data became big, organisations adopted cloud computing, and spreadsheets took a backseat to actionable data visualisations and interactive dashboards. Self-service analytics grabbed the reins and democratised the world of data reporting products. Suddenly, advanced analytics wasn’t just for the analysts.

In 1958, a computer scientist, Hans Peter Luhn, published an article titled “A Business Intelligence System” in the IBM Journal of Research and Development that would later become the foundation for how BI is understood today. Luhn’s article suggested using technology to simplify the process of gathering data rather than sifting through mountains of information by hand. Today, we understand BI as such; using technology to compile and analyse data, translate it into useful information, and then making strategic decisions based on the results.

The recurring trend in next-generation BI tools is that of simplicity. Complex data analysis has become a breeze with the introduction of self-service analytics platforms. Advances in BI technology alleviate the stress and labour hours of gathering, sorting, and using data to make informed business decisions. But how have these changes affected businesses in the last few years – and what’s to come.

Self-service analytics

Self-service analytics has consistently topped the list of BI trend predictions each year, showing the increasing accessibility of BI tools and the positive impact of putting data back in the hands of individual teams, departments and leaders within organisations. The rising adoption of self-service analytics enables users to gain deeper insights to drive data-focused initiatives across the entire organisation—without having to rely on IT.

The rise of self-service analytics has also brought more attention to the growing necessity for modern organisations to adopt a data-driven culture. Businesses all over the world are using elegant visualisations and dashboards to tell their data story, and they’re doing it without using up a massive amount of IT resources. As advances are made in BI technology, the process of implementing a BI tool has become much less of a daunting task. Implementation and adoption time have been almost cut in half, data integration tools stepped into the ring, and talk of data governance/security solutions became common watercooler conversation.

Integrating technology

2017 was a major year for the BI industry. Significant advances were made in the way new technology integrated with existing BI processes, along with the development of tools that allowed data from separate applications or data stores to unite and display the big picture. The cloud was widely adopted due to advanced security and accessibility. Machine learning increased revenue for businesses by tracking buyer behaviour and analysing databases faster than ever before. AI became more prominent, and trials began to determine if AI could eventually replace human data scientists altogether.

By 2018, data analytics became a routine part of daily duties for most organisations. The value of using a BI tool had become a given, but the question then moved to choosing the right tool to fit an organisation’s unique and specific needs. Leaders began to take a look at common pain points in the business and started to learn more about how they could get the most value from a BI tool by asking questions such as, what do we want to achieve from analysing our data? How can BI help us reach our business goals? How can we use data to improve employee retention? Or measure turnover? Can we see which product drove the highest volume of sales in Q1? Could these insights really help us locate and obtain net new clients?

BI has never been a one-size-fits-all answer. That’s the reason it initially gained popularity, as different departments have different data. Sales won’t need the same Monthly Advertising Report that Marketing will use to create next month’s budget. BI was the hottest new tool that could help any person, in any position, in any company use their data to make fact-based decisions. These custom data reports guided businesses in the direction of the most important metrics; whether it’s HR, Marketing, Sales or Finance.

BI now and in the future

BI and data analytics technology is constantly evolving and the market shows no signs of slowing down. Business Intelligence makes data of any kind easy to digest with stunning visualisations, detailed historical analysis, and customisable reports. In fact, by the end of 2019, the Global BI and Analytics Market is expected to grow to $20 billion.

In 2020, experts say we will continue to see increased adoption of BI tools among businesses of all sizes that hope to speed up their organisation’s journey to success. Retail, construction, healthcare, banking and transportation are expected to make up the majority of new adopters. Additionally, the way data is created and handled will experience significant change in the coming years.

But what does the far future look like for BI? What was once just a tool for pinpointing patterns in an organisation’s data, has evolved into a robust, real-time solution focused on using  hard and fast data to not only see a snapshot in time, but to view the entire picture. BI enables companies to make the best possible decisions using their own data, and the organisations that capitalise on this technology that will reach their business goals.

Image by Pexels from Pixabay

Emarsys and Persado team up for campaign automation

Persado and Emarsys customers are now be able to generate, test and serve their marketing campaigns in minutes using a combined platform that the partners claim takes a fraction of the time of a traditional setup.

Through the joint API, Emarsys campaign results will flow back into Persado, giving clients access to quantitative and qualitative analysis on the variables that impact performance.

Happy Socks used the system last year for its Black Friday campaign, which is being held up as a the poster boy of the collaboration.

“This integration is incredibly exciting because both Persado’s and Emarsys’ technologies are critical for driving success. Emarsys gives us freedom to easily setup and test campaigns, and Persado helps us empower our messages by generating the perfect language to improve our content’s performance and relevancy,” said Marc Verschueren, Director of Online Marketing and Sales at Happy Socks. “Coming out of our recent Black Friday campaign, we saw an average open rate uplift of 21 percent, and an average click-through-rate uplift of 37 percent. These technologies helped us stand out by taking more risks and thinking outside the box, all without worrying about missing the mark.”

“Today’s CMOs are bombarded with solutions claiming to drive ROI, so identifying the technologies and offerings that provide real value has become increasingly difficult. Marketing teams need products that intelligently achieve results and close the gap between goals and outcomes,” said Assaf Baciu, Co-Founder & SVP of Product and Engineering, Persado. “Through this partnership, we are uniting our strengths in automation, AI-powered predictive insights and analysis to add mathematical certainty to the development of creative while eliminating burden. We are thrilled to work together to give marketers the confidence they deserve.”

“We know that poor attempts to tailor communications will turn customers off. Marketers therefore rely on smart technology to automate and personalize communications across channels, at scale and often in real-time,” said Dave Littlechild, Global Head of Partnerships & Alliances at Emarsys. “This partnership helps us bridge the technology adoption gap that stands between a marketer and his or her ability to profitably driving more revenue. We are excited and look forward to the future as partners.”

The integration of Persado within Emarsys is available to clients now.

Do you provide Web Analytics services? We want to hear from you!

Each month on Digital Marketing Briefing we’ll be shining the spotlight on different parts of the print and marketing sectors – and in August we’ll be focussing on Web Analytics solutions.

It’s all part of our ‘Recommended’ editorial feature, designed to help marketing industry professionals find the best products and services available today.

So, if you specialise in Web Analytics and would like to be included as part of this exciting new shop window, we’d love to hear from you – for more info, contact Lisa Carter on lisa.carter@mimrammedia.com.

Here are the areas we’ll be covering, month by month:

August – Web Analytics

September – Conversion Rate Optimisation

October – Lead Generation & Tracking

November – Brochure Printing

December – Creative & Design

For more information on any of the above topics, contact Lisa Carter on lisa.carter@mimrammedia.com.

Survey demonstrates the qualities of high-performing marketers…

Autopilot has revealed that high-performing marketers are surpassing their peers when it comes to customer journey marketing, with some generating revenue growth by as much as 122 per cent.

Consisting of 505 marketer responses, the email marketing firm’s ‘2016 State of Customer Journey Marketing‘ report found high-performing marketers generate revenue 58 per cent faster than their colleagues; acquire 23 per cent more leads; are twice as happy with their performance; and win a higher number of customers.

Brand awareness was pinpointed as a ‘main measure of marketing success’ (29 per cent), closely followed by customer satisfaction (22 per cent), and, for B2B marketers in particular, 43 per cent claim investing in brand assets is a ‘top priority’.

The report states: “All marketers are prioritising brand awareness, converting leads to sales and generating new leads. But high performers are investing in customer events and marketing, referral and satisfaction programs, and analytics and attribution, rather than in online ads, to get there.”

High-performers affirm the top three investment areas are: customer events and marketing (35 per cent), loyalty referral programmes (29 per cent) and analytics and attribution (19 per cent).


Download Autopilot’s research here