Digital Marketing Solutions Summit | Forum Events Digital Marketing Solutions Summit | Forum Events Digital Marketing Solutions Summit | Forum Events Digital Marketing Solutions Summit | Forum Events Digital Marketing Solutions Summit | Forum Events

Posts Tagged :

Research

Global online Advertising Expected to Reach $1,089bn

A rise in expenditure on digital media across various industries and a surge in popularity of streaming platforms is driving the growth of the global internet advertising market, according to new data.

A new report from Allied Market Research pegged the global online advertising market at $319 billion in 2019, growing to hit $1,089 billion by 2027, equivalent to a CAGR of 17.2% over the forecast period.

The report cautions that rising adoption of ad-blockers has restrained the growth to some extent, but that the emergence of advertising automation and a rise in adoption of identity-based pay-per-click (PPC) marketing are projected to pave the way for lucrative opportunities in the coming years.

Specifically, it says the impact of COVID-19:

  • Increased use of social media leading to rising drift to resort to social media platforms to endorse various media content with the target audience, which boosted the global market for Internet advertising.
  • That trend is likely to continue post-pandemic as well, since advertising of media and entertainment content over Twitter, Facebook, and Instagram has almost become a new drift in the recent times.

The global internet advertising market report is analyzed across platform type, ad format, pricing/revenue model, enterprise size, industry vertical, and region. Based on platform type, the mobile segment accounted for nearly two-thirds of the total market share in 2019 and is expected to rule the roost by 2027. The same segment would also manifest the fastest CAGR of 18.9% during the forecast period. 

Based on pricing model, the performance-based segment garnered more than half of the total market revenue in 2019 and is expected to lead the trail by 2027. At the same time, the hybrid segment would manifest the fastest CAGR of 22.7% throughout the forecast period.

Based on geography, North America held the share in 2019, holding around two-fifths of the global market. The market across Asia-Pacific, on the other hand, would cite the fastest CAGR of 21.6% from 2020 to 2027. The report also analyzes the market growth across LAMEA and Europe.

IAB: 50% of marketers saw an increase in affiliate spend in 2020

Many affiliate programmes saw high double and occasional treble digit growth in 2020, according to a new report from the IAB Affiliates & Partnerships Group.

With almost one in five brands and agencies spending more than £250k per month on their affiliate campaigns, the organisation says it’s clear that it’s a serious route to market.

However, Kevin Edwards, Global Strategy Director at AWIN and Chair at the IAB Affiliates & Partnerships Group, says growth has to be weighed against those brands who reduced their spend.

The travel sector remains an important one for the affiliate channel and the IAB remains hopeful that it will fire back in the second half of 2021, taking advantage of pent up consumer demand. It expects the most favoured affiliate business models – cashback and content sites – will be ready to support brands when that time comes.

Edwards says that digital marketing in general faces challenges in tackling the ability to track campaigns in the future, so offering clarity on the current state of play within the channel is vital: “Alongside demonstrating the value of affiliate marketing and ensuring transparency and trust are at the heart of what we do, this survey sets out a blueprint for future projects.

“The affiliate industry has a proud heritage of demonstrating its value to brands and agencies, and this survey helps guide our future strategy in proving why we should be front and centre of advertisers’ future marketing plans.”

You can download the report from the IAB website here.

Shift to subscriptions increases brand connections

Subscription businesses have grown nearly six times faster than the S&P 500 over the last nine years, driven by an increase in consumer demand for the use of such services.

That’s according to  Zuora’s bi-annual Subscription Economy Index (SEI), which was conducted online by The Harris Poll among 13,626 adults across 12 countries.

It reveals the growing consumer preferences for use of subscription services over the ownership of physical products. Results found within the End of Ownership report include: 

  • Use of subscription services is growing. 78% of international adults currently have subscription services (significantly higher than 71% in 2018), and 75% believe that in the future, people will subscribe to more services and own less physical ‘stuff’. 
  • Subscriptions increase brand connection. Nearly two-thirds of subscribers (64%) feel more connected to companies with whom they have a direct subscription experience versus companies whose products they simply purchase as one-off transactions. 
  • Consumers want to pay for what they use. Nearly three-quarters of international adults (72%) would prefer the ability to pay for what they use, rather than just a flat fee. 
  • Convenience, cost savings, and variety are top subscription benefits. Convenience (42%) tops the list of benefits for subscribing to a product or service instead of owning it, followed by cost savings (35%) and variety (35%, up from 32% in 2018). 

As a result of this burgeoning consumer lifestyle trend, subscription businesses have grown. For the first time since its inception in January 2012, the SEI growth rate reached 437% growth as it analyzed the impact of subscription businesses by sector, comparing subscription businesses in Software as a Service (SaaS), Internet of Things (IoT), Manufacturing, Publishing, Media, Telecommunications, Education, Healthcare and Business Services to their respective S&P 500 Industry benchmarks. 

When looking only at the year 2020 the Subscribed Institute found that:

  • Subscription business revenue outpaced that of their product-based peers. Last year, revenues of subscription companies in the SEI grew 11.6%, while the S&P 500 sales declined -1.6%. In Q4 alone, subscription businesses experienced revenue growth at a rate of 21%, seven times faster than S&P 500 companies’ growth rate of 3%.
  • Revenue per subscriber surpassed the 2019 rate. Subscription businesses in Q4 2020 had an 18% average revenue per user rate, compared to 14% in Q4 2019. The increase indicates that subscription businesses in the SEI are deepening relationships with customers and delivering services that increase in value over time. 
  • Subscription companies in the SEI performed better compared to regional stock markets. In Q1 2020, lockdowns and other safety measures seemed to slow subscription revenue growth (in APAC, revenue even contracted), but when lockdowns returned in Q4, subscription revenue growth accelerated, indicating that subscription companies were effective in adapting their offerings quickly. 

“The time is now for companies to embrace the subscription business model,” said Amy Konary, Founder and Chair of The Subscribed Institute at Zuora. “Our bi-annual Subscription Economy Index suggests that brands can increase value to their customers through the on-going delivery of services when and where they’re needed.” 

Download the Subscription Economy Index and the End of Ownership reports.

Using emotion in advertising increases the sales of high-price and high-quality products

The use of emotion in TV adverts increases sales of high-quality and high-priced products, according to new research by emlyon business school.

However, if you’re trying to increase the sales of a low-quality and low-priced product, informative adverts are more likely to be successful, say researchers.

The study, by Ivan Guitart, Associate Professor of Marketing, and his colleague Stefan Stremersch, Professor of Marketing at the Erasmus School of Economics, looked into how informational and emotional appeals in television adverts influence online search and sales. They found that the impact of these appeals depends on the price and quality of the product.

The authors analysed the volume of online search, sales, and the content and expenditure of more than 2,300 ads promoting 144 cars during a period of four years.

The findings reveal that for high-price and high-quality products, an increase in emotional content in adverts led to more sales and online searches than an increase in informational content.

In contrast, for low-price and low-quality products, the use of information in adverts was more effective at increasing sales than the use of emotions. However, this is at the expense of the number of online searches these products get.

If managers of low-quality products want to increase the volume of online search their products receive, they should design adverts with more emotional content.

Professor Guitart said: “Managers of low price and low-quality products need to decide whether they want to use high level of emotional content to increase online search at the expense of sales, or use high level of informational content to increase sales, at the expense of online searches.”

The researchers say increasing online searches is an important objective because the more consumers learn about products the more likely they are to talk about them and even purchase them.

The findings of the study give insights and advice for marketing managers in their advertising strategies. Marketing managers of high-quality and high-price product should appeal to emotions if they want their adverts to drive sales, while marketing managers of low-quality and low-price products should highlight the practical applications of their product in order to boost sales.

The study was published in the Journal of Marketing Research.

70 percent of marketers expect to boost spend in 2021

Nearly two-thirds of those surveyed by the CMO Council say they will boost marketing spend in the coming year and most don’t expect to downsize or re-structure their organisations.

While many industry sectors have struggled in the past year, it appears most marketers have already done all the cutting, pruning and restructuring of budgets and teams in 2020, notes the Chief Marketing Officer (CMO) Council. 

The organization has 16,000 members in 10,000 companies across more than 110 countries worldwide. Members collectively control nearly $1 trillion of annual marketing spend.

Key indicators of a positive outlook come from a year-end Getting It Done in 2021 audit of around 200 CMO Council members across all regions worldwide. Key findings reveal:

  • A surprising 65 percent will increase marketing spend in 2021; just 10 percent will reduce their budgets, while 24 percent expect no change
  • A large percentage of marketers (70 percent) report significant or growing investments in marketing technology to improve effectiveness
  • Most important areas of marketing automation and transformation will be sourcing and using customer data insights, executing campaigns more effectively, as well as improving operations and performance 
  • Just a quarter of marketing leaders say they will downsize or re-structure their marketing organizations in 2021, in contrast to 64 percent who will not
  • Working more effectively with lines of business is the number one priority for marketing leaders, who are also keen to lower cost, increase efficiency and do a better job of both globalizing and localizing campaigns
  • Over half of marketers surveyed want to optimize their customer journey, and more than a  third want to boost acquisition and conversion rates through better data-driven interaction and digital innovation
  • Interestingly, across company sizes, regions and industries, priorities remained consistent: marketers are looking to increase spend and automate; likewise they are looking to save costs through efficiencies rather than through staff cuts

“The most relevant and compelling areas of conversation among our members right now are all about ROI, efficiency and revenue optimization,” said Manuel Hüttl, Senior Vice President Europe beim CMO Council.” This means being more focused on digital marketing transformation, creating value from customer data, and upgrading customer engagement and experience.” 

The online survey was fielded in December and early January and a summary report and infographics can be downloaded at https://cmocouncil.org/thought-leadership/reports/getting-it-done-in-2021.

UK entertainment sales driven to new highs by lockdown streaming

Locked down Britain turned to digital music, video and games in record numbers in 2020, increasing entertainment revenues by 16.8% to a record £9.05bn, according to preliminary data compiled by the Entertainment Retailers Association (ERA).   

It was the fastest growth rate since records began, driven above all by digital services, who saw revenues increase by £1.4bn over 2019 to a new high of £7.8bn. 

Digital video services spearheaded by Netflix, Disney+ and Amazon Prime Video increased revenues by a remarkable 37.7% over 2019 while growing music streaming subscriptions saw recorded music revenues score their best result since 2006.

Gaming comfortably retained its lead as the largest of the three sectors, generating sales of more than £4bn for the first time.

Overall more than 80 pence in the pound spent on entertainment now goes to digital services rather than physical formats. Amid generally declining physical formats, vinyl LPs remain the shining exception, increasing sales by 13.3%. 

ERA CEO Kim Bayley said, “If there was ever a year in which we needed entertainment, it was 2020. The trend towards an increasingly digital entertainment market may be long established, but no one could have foreseen this dramatic leap as digital services filled the gap left by shuttered cinemas, concert halls and retail stores. With much of the country shut down, ERA’s members provided a welcome revenue stream for thousands of musicians, actors, directors and countless backroom staff.”

UK Consumers’ Favourite Brands revealed – And Amazon is top

The DMA has revealed the findings of its latest ‘How to win Trust and Loyalty’ research, which set out to gauge which brands UK consumers are most loyal towards.

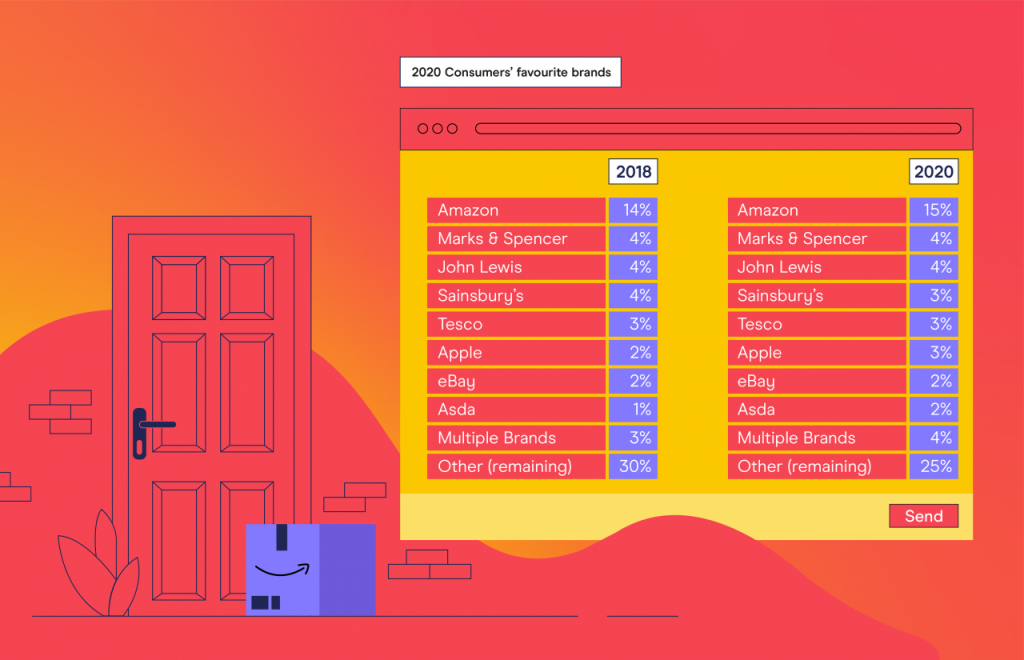
Amazon turned out to be the most mentioned brand, with 15% of consumers naming it, followed by John Lewis (4%), Sainsbury’s (4%), and Tesco (3%).

When the DMA asked the same question back in 2018, the top choices looked very similar. Indeed, consumers mentioned Amazon (14%) followed by equal percentages selecting Marks & Spencer (4%), John Lewis (4%) and Sainsbury’s (4%).

Somewhat surprisingly, despite Amazon’s near-ubiquity across so many areas of consumption, the brand hasn’t gained any further traction with customers over the last 2 years.

The DMA says that, hypothetically, a reason behind such consistency can be explained by consumers’ view of Amazon more as a service provider rather than a brand to engage with. Data also reveals consumers’ loyalty to Amazon as being driven by convenience (54%) rather than a genuine connection (46%).

When consumers were asked to tell us their favourite brands, a quarter (25%) mentioned other brands outside the top ten, highlighting the variety of businesses that have managed to conquer consumers’ loyalty and that big brands are not as dominant as we might expect.

Data also revealed that about a third of consumers (35%) report not feeling loyal enough to any brand to name it as their favourite. This group’s voice is a clear testimony of the daily challenge brands must deal with: connecting with customers, gaining their trust, and being thought of when it’s time to purchase.

The DMA also dug further into why these consumers do not feel a sense of loyalty towards any brand. Consumers offered a range of reasons, from simply not feeling strongly about brands to wanting to try new ones.

The good news is that two out of the three reasons given are barriers that brands should be able to overcome themselves, with the right strategies.

Indeed, reward mechanisms for continued loyalty, such as wider benefits and offers, can be revisited to give consumers relevant value. Furthermore, the DMA says innovation and communication about improvements can be used to attract those who seek change and novelty. 

Read the full report here. 

Content Management

Content marketing ‘providing increased value to CMOs’

Over a third of CMOs believe establishing a thought leadership position provides best results for sentiment and relationship building.

That’s according to the findings of iResearch Services’ thought leadership research, which asserts that content marketing, supported by issues-led thought leadership, is the way forward for CMOs.

The research gathered insights from 500+ CMOS/-1 professionals spanning the UK and USA. The aim of the research was to establish how, when and where marketing budgets are being allocated and through which brand channels the majority of effective content is being published.

The survey asked experienced marketing professionals to choose which form of marketing engages best with their audience and the budget allocated to each area; share their preferred techniques they use as a marketer to research their target audience when creating their marketing strategy; and analyse what types of content they believe provide the best engagement.

Key findings include:

  • Content marketing receives the biggest marketing budget allocation (23.5%) compared to just 10% spent on product marketing and social media marketing separately.
  • On a scale of 1-5, most marketers believe that content marketing delivers the highest levels of audience engagement compared to other forms of marketing.
  • One third of marketers believe opinion based content provides the best engagement and almost three quarters (71%) believe thought leadership provides the best results for sentiment and relationship building, yet two thirds (66%) of marketers still believe advertising is an effective element of a marketing strategy. 
  • 61% of marketers believe that issues-led content that shows an understanding of the audience’s business or industry challenges receives higher engagement.

The research shows the way people are consuming content is changing, with more CMOs utilising content marketing (23%) as opposed to investing in event marketing (11%), as the remainder of the calendar year will continue to focus on virtual events as a result of Covid-19.

Yogesh Shah, CEO of iResearch, said: “It is important for us to continue to address the needs of CMOs and to ensure they can effectively communicate with their target audience and therefore strengthen their sales pipeline. Creating relatable, issues-led content is key to this and it is clearly a form of content that is an integral part of all marketing strategies. Organisations need to position themselves as industry leaders by sharing their expertise, and a data-driven thought leadership strategy is exactly the way to do that.”

For the full research findings, click here.

British TV Presenters ‘Earning up to £15K Per Instagram Post’

Holly Willoughby, Ant & Dec and Stacey Solomon lead a list of the leading Instagram earners working on UK TV, with fees topping out at nearly £15,000 per post.

The insight comes after GamblingDeals.com identified the top British TV presenters by researching the biggest and trending UK TV shows, with only British TV presenters who present and/or reside in the UK chosen. They then used Influencer Marketing Hub’s Sponsored Post Money Calculator to calculate the maximum potential earnings of each account per sponsored post.

In first place is Holly Willoughby, with the potential to earn £14,174.16 per sponsored post on Instagram. As one of daytime TV’s best-dressed presenters, her sense of style and kind-natured approach apparently sits well with 6.9 million Instagram fans and could help to earn her a little extra on top of her handsome salary.

Britain’s well-loved Geordie duo Ant & Dec claim second place. As the faces of I’m a Celebrity Get me Out of Here!, Britain’s Got Talent and more, the entertainers could rake in up to £8,507.73 per post on Instagram.

Once famous from The X-Factor but now a staple in daytime TV, cheery Stacey Solomon claims third place. Her uplifting Instagram posts with partner in crime Joe Swash and their newborn could earn her a hefty £7,850.15 if they were sponsored.

In fourth place is adventurer-turned-TV-presenter Bear Grylls with the earning potential of £7,652.26 per post, followed by radio and TV broadcaster Fearne Cotton in fifth – with a new podcast to plug and a focus on mental wellbeing, positive engagements with her fans could earn her an impressive £6,643.56 extra per collaboration.

Completing the top ten earners on Instagram are:

  • Phillip Schofield – up to £6,568.87 per post
  • Jeremy Clarkson – up to £6,274.73 per post
  • Rochelle Humes – up to £4,264.26 per post
  • Mark Wright – up to £3,634.40 per post
  • Emma Willis – up to £3,572.03 per post

All earnings are estimates only. Data was calculated on 30/10/20 and accurate as of then.

The top 20 earning TV presenters

TV presenterInstagram (@)Number of Instagram followersEstimated potential earnings per post (£)
1Holly Willoughbyhollywilloughby6.9m14,174.16
2Ant & Decantanddec4.1m8,507.73
3Stacey Solomonstaceysolomon3.8m7,850.15
4Bear Gryllsbeargrylls3.7m7,652.26
5Fearne Cottonfearnecotton3.2m6,643.56
6Phillip Schofieldschofe3.2m6,568.87
7Jeremy Clarksonjeremyclarkson13m6,274.73
8Rochelle Humesrochellehumes2m4,264.26
9Mark Wrightwrighty_1.7m3,634.40
10Emma Willisemmawillisofficial1.7m3,572.03
11Paddy McGuinnessmcguinness.paddy1.7m3,554.32
12Joe Swashrealjoeswashy1.6m3,449.60
13Katie Piperkatiepiper_983,0003,009.16
14Ruth Langsfordruthlangsford969,0002,968.35
15Rylan Clark-Nealrylan1.4m2,929.85
16Kate Garrawaykategarraway952,0002,918.30
17Stacey Dooleysjdooley918,0002,811.27
18Nick Grimshawnicholasgrimshaw1.3m2,799.72
19Piers Morganpiersmorgan1.2m2,620.31
20Davina McCalldavinamccall1.2m2,544.85

SME confidence holds firm ahead of Christmas period

For the first time this year, small business confidence has held firm from one quarter to the next – with marketing services sectors seeing growth forecasts rise on Q2 levels.

After the Government announced its three-tier Covid restrictions, new research suggests the avoidance of a second national lockdown and certainty of direction until March has had a positive impact on UK small business confidence.

The findings come from a rolling study from Hitachi Capital Business Finance that has tracked small business growth forecasts every quarter for the last six years. Before Covid-19 struck – and even during the period of the Brexit vote – the percentage of small businesses predicting growth for the three months ahead stayed at between 36-39% for six consecutive quarters.

In April 2020, this crashed overnight to just 14% of small businesses predicting growth. 

The UK’s re-emergence from lockdown in July 2020 saw a sharp resurgence in confidence, with the percentage of small business owners predicting growth for the next three months doubling to 27%. The latest data conducted this week by Hitachi Capital reveals that the percentage of small businesses predicting significant and modest growth remains unchanged since summer months (27%). Further, the Q4 data reveals the third consecutive quarter where the percentage of small businesses fearing collapse has fallen – down from a high of 29% in Q2 2020 to a current figure of 12% for Q4 2020.

Joanna Morris, Head of Insight at Hitachi Capital Business Finance, said: “Despite the changed context from the summer months, with Covid numbers now again rising sharply, our data suggests small businesses are reacting positively to the current circumstances. The avoidance of national lockdown and the consensus that there will be restrictions through until March has at least given small business owners a degree of certainty against which to plan. 

“Our figures for 2020 show that small business confidence has had sharp rises and falls since the pandemic struck. Our new research conducted the day after the Government’s announcement on three-tier restrictions gives the first reaction from the small business community. The stabilising of confidence levels between Q2 and Q3 is a really important development as it suggests smaller enterprises (that can operate) are adapting to the new reality – and accept the prospect that we may all be in for a long-haul fight against Covid.” 

By sector the research also gives a welcome boost for the high street. Ahead of the critical Christmas period, there was a marked rise in the proportion of retail small businesses predicting growth (up from 27% to 35% in three months). The property and marketing services sectors also saw growth forecasts rise on Q2 levels.  

Conversely, growth forecasts in manufacturing fell sharply (down from 30% to 23% in three months) – and the hospitality sector remained in a serious position; here only 18% of small business owners predicted any form of growth, whilst 53% predicted contraction. Overall 29% of hospitality sector small businesses predicted they would struggle to survive, more than double the national average (12%).