Digital Marketing Solutions Summit | Forum Events Digital Marketing Solutions Summit | Forum Events Digital Marketing Solutions Summit | Forum Events Digital Marketing Solutions Summit | Forum Events Digital Marketing Solutions Summit | Forum Events

Posts Tagged :

Research

Instagram ‘attracting a larger audience than Facebook’ among brands

Instagram has a larger audience and nearly 20X more interactions than Facebook among top 50 brand profiles, according to Socialbakers’ new Q4 2019 Trends Report.

Key insights from the report include Instagram overtaking Facebook in audience size, the relative decline in engagement during the holiday season, the popularity of vertical videos, the dominance of women among fans and followers, growing ad spend, and the continuing explosion of influencer marketing. 

“The writing has been on the wall for some time, but now it’s official. When it comes to the top 50 biggest brand profiles, Instagram has a larger audience than Facebook,” said Yuval Ben-Itzhak CEO, Socialbakers. “That development was not a surprise. What was unexpected in Q4 2019, however, was the relative decline in engagement during the holiday season. This is a warning sign that brands require a deeper understanding of which types of content their audiences find compelling, and an agile method to get that content in front of them.”

The key findings of the Q4 2019 Trends report include:

·         For the first time globally, Instagram surpassed Facebook in audience size – but for the top UK brand profiles, Facebook still has a marginally bigger audience, but greater engagement is found on Instagram

·         Despite efforts to attract consumers during the holiday period, post interactions for both Instagram and Facebook were lower in Q4 2019 than Q4 2018

·         Women make up the majority of fans and followers of brand pages on Instagram and Facebook, representing over half (56.4%) of the audience engaging with brands

·         Whilst 70% of videos on Facebook brand pages are shot horizontally, viewers are more likely to complete a vertical video than horizontal (29.9% vs. 22.2% respectively)

·         Ad spend on Instagram Stories increased by 40% over the last year, and by 91% over the last two years. Meanwhile, in the UK, brands are still posting more to the Instagram News Feed

·         The number of influencers using #Ad exploded by 90.5% in Q4 2019

·         The Services category (including lawyers, accounting services and IT services) found a 66.7% jump in engagement

Based on the top 50 biggest brand profiles worldwide, there was a notable change in Q4 2019. For the first time, the total audience on Instagram surpassed the total audience size on Facebook. Additionally, the total interactions on Instagram were nearly 20 times larger than those on Facebook. So, even though the top 50 brands published more posts on Facebook, the engagement on those posts didn’t reach the numbers that Instagram was able to achieve.

For the top UK brand profiles Facebook still has a marginally bigger audience. However, while brands are posting roughly the same amount of content to Facebook and Instagram, they are seeing significantly more engagement on Instagram. The lesson here is that UK brands need to focus on their Instagram strategy as by splitting their content between both platforms they are likely leaving interactions on the table. 

Engagement: A surprising drop in interactions

In the UK the industries that are seeing the most engagement across Facebook and Instagram are ecommerce, fashion and retail. The data shows that ecommerce brands are really leveraging the potential of Facebook, whilst Fashion brands are running the show on Instagram. 

Despite attempts to attract consumers during the holiday season, the relative post interactions for both Instagram and Facebook were lower in Q4 2019 than a year ago. This was true even among the most successful industries on social media. Fashion, the top industry on Instagram, decreased by 19.4%, while the top industry on Facebook, Ecommerce, decreased by 9.6% versus Q3 2019. This may indicate that brands need to get smarter about the content they post, and focus on top quality content in smaller volumes to increase engagement.

However, one interesting success story in Q4 engagement is the Services category. It achieved a 66.7% jump in engagement on Instagram compared to Q3 2019. On Facebook, Services finished fourth with 7.6% of total interactions after not making the top eight in the previous quarter. Services is a wide-ranging category that includes lawyers, accounting services, hairdressers, car repairs, IT services, conference and event organisers, and weight loss courses.

Format: Vertical videos pull viewers in

Marketers often wonder whether viewers prefer videos that were shot horizontally or those that were shot vertically. Currently, about 70% of videos on Facebook brand pages are shot horizontally. But according to Q4 data from those Facebook brand pages, vertical videos perform better than horizontal videos across the board. For videos shorter than 30 seconds (which is the most popular video length), vertical videos were completed by viewers 29.9% of the time, while horizontal videos were completed 22.2% of the time. 

Demographics: Women are dominant on social media

According to the Q4 2019 data, women make up the majority of fans and followers of brand pages on both Instagram and Facebook. On Instagram, 58% of brand page followers were female, comprising the majority of every age demographic. On Facebook, women made up 56.7% of the total audience of page fans, although there were slightly more men in the 18-24 age demographic. Women are also the largest group of people mentioning and interacting with brand pages in the prime marketing demographic of 25-34. Overall, women represented 56.4% of the audience engaging with brands in Q4 2019.

Ad spend: Instagram rises but Facebook remains the leader

As in past quarters, ad spend on Instagram Stories continues its rapid growth, although Facebook Feed remains the leader with 58.3% of total ad spend. For the first time, Instagram Stories reached 10% of ad spend in the second half of 2019. Overall, the spend on Instagram Stories increased by 40% over the last year, and by 91% over the last two years.

In the UK the data shows that brands are still posting more to the News Feed. Since Stories are proving to be a highly engaging content format globally, perhaps UK brands need to up their game on Stories. 

Other ad spend trends include the rise of Instagram Explore and Facebook Marketplace as a destination for advertising dollars. In its first five months, the percentage of ad spend on Instagram Explore grew to 1.32%. And over the last year, ad spend on Facebook Marketplace grew from 0.72% in December 2018 to 1.31% at the end of 2019, an increase of more than 80%.

Influencer marketing: No sign of slowing down

One trend that remains unchanged is the skyrocketing growth of influencer marketing. In Q4 2019, the number of influencers using #Ad or the local language version in their posts exploded by 90.5%. For the third straight quarter, the top Instagram brand profile in the world associated with influencers was Walmart, which had 854 mentions from 619 influencers in Q4 2019. Other profiles with successful influencer partnerships included Daniel Wellington, iDeal Of Sweden, and FashionNova.com.

The complete Q4 2019 Social Media Trends Report with supporting graphics is now available for free download.

Influencer marketing in the affiliate sector increases 9%

Influencer publishers drove 610,000 sales to advertisers in 2019 up to September; 5.5% more than 2018, while revenue made from influencer sales in that period totalled £29.7m – 9.2% up from 2018 and AOV of influencer marketing was £48.47, representing a 3.4% increase.

The data was compiled by the team at global affiliate network www.awin.com, who looked at Awin’s top 100 influencer publishers in the UK, combining subnetworks, talent agencies and individual influencers, for the first three quarters of 2019 and then compared results to the same period in 2018. 

2019 saw an increase across all metrics for influencer marketing, which confirmed industry-wide forecasts that predicted advertisers were going to be allocating more marketing budget to influencer marketing for the year. 

In terms of sales, influencer publishers drove a total of 610,000 sales to advertisers on the Awin network for the first nine months of 2019, representing a 5.5% increase on the previous year. This amounted to £29.7m in revenue to advertisers, which was a substantial increase of 9.2% on the year before.

The amount of commission paid out to influencer publishers saw a significant uplift of 18.9% from 2018, amounting to £3.78 million. The average order value in influencer marketing for 2019 was also up 3.4% on the previous year, totalling £48.47.

Retail & shopping continues to dominate the influencer sector, accounting for 99.2% of the top 100 advertisers, whilst there has been an increase for those in the telecoms sector, who made up 0.6%.

Fashion is the sector investing in influencer marketing the most, with eight of the top 10 advertisers operating in this industry, with the remaining two in the beauty sphere. The dominance of fashion & beauty retailers is maintained in the top 50, but there has been an increase of advertisers in the health supplements space entering into this list.

Commenting on the findings, Carina Toledo, Influencer Partnerships Manager at www.awin.com, said: “Influencer marketing has increased massively in popularity over the past few years, and has come to form a key part of marketing strategies, particularly in the fashion and beauty sectors. The practice is certainly set to continue increasing, and the rise in its use in the telecoms and health supp

Two-thirds of consumers ‘Don’t understand how their data is used’

Over half (58%) of consumers want long term relationships with brands, but 33% saw irrelevant retail offers as the biggest marketing mistakes, indicating a personalisation disconnect.

That’s according to the latest APEX report from Valitor, which reveals the key marketing challenges brands will face in using customer data to build relationships.

The study also found that almost half (48%) of consumers think that when it comes to relationship ‘building’, all they see after-sale are spam emails.

In fact, it seems personalisation across the board does not meet expectations. 68% do not know how their data is being used by brands. Valitor says this knowledge gap, combined with the implementation of GDPR and the ongoing discussions of data being used in political discussions, has spiked consumer interest in data use and privacy.

However, while interest has increased, the actual use of data by brands is creating uncertainty, confusion and setting unachievable expectations about the sort of interactions customers should expect. 

Halldór Lúðvígsson, Managing Director, Omni-channel solutions at Valitor, said: “The latest APEX report reveals that consumers want a long term relationship with brands, which is clearly an opportunity that needs to be pursued. To succeed in establishing relationships, brands need to show customers that by having their data, they are able to create the long term value they crave. Currently, though many consumers feel brands’ efforts are missing the mark, which is risking weakening customer retention.”

The good news for brands, however, is that consumers are still happy to provide them with personal data, as long as it is used in the right way. In fact, 75% of consumers are comfortable with the concept of a brand holding personal information in order to improve the services and relationship. Consumers also revealed that they are most willing to share email addresses (42%), followed by clothing size (29%). But in order to keep consumers happy, brands need to ensure that they use this data wisely if they are to encourage the sharing of more types of information. 

Meanwhile, the outdated practice of getting data and then taking a “spray and pray approach” has clearly had negative effects on consumers. For example, over a third (34%) of consumers say that they have been made to feel like a brand no longer wants to impress them once they have parted with their money. Another third (33%) aren’t convinced brands still care about them after the sale is done. While a quarter (25%) highlight the fact that occasional offers are not the same as a proper customer service relationship. 

Other key report findings:-

  • The 18-35 age group is far more confident in their understanding of how brands use their data (18-25 were 40%; 26-35 were 43%) compared to the 66+ age group (19%).
  •  44% of consumers take notice of marketing communications from a brand:
    • 56% take notice of emails 
    • 46% notice free samples/trials 
  • 52% of 18-25 years – the highest proportion of all age groups (and the emerging customer base for many brands) – are receptive to messaging from brands. 
  • The oldest consumers, 56-65 and 66+ are the least likely to pay attention to brand marketing.

Download the full report here.

UK public ‘doesn’t trust social media’ or influencers

Rightly or wrongly, Brits don’t always trust what they see on their favourite social platforms.

That’s according to data from YouGov, which indicates 41% of regular users claim to have seen inaccurate content over the last month, while nearly a fifth of (17%) mainstream social media users go even further and say they’ve seen completely false content.

What’s more, 21% of users say they’ve come across content they consider to be misleading, 20% say they’ve come across misinformed content, and 19% say they’ve seen content that’s been manipulated or distorted.

Typically, the younger a user is, the more likely he or she is to have noticed information that is misleading. Are older people more likely to take social posts at face value?

Moreover, no single group of users is considered completely authentic: only 25% of regular users say that the profiles of their family give a ‘very honest’ portrayal – and friends, colleagues, celebrities and influencers perform even worse.

Almost half of users (48%) believe that the profiles of celebrities are either ‘not at all’ or ‘somewhat dishonest’, with only 22% believing that the reverse is true (‘honest’ or ‘very honest’ portrayals).

In addition, regular users of social networks are sceptical of ‘super-influencer’ Kim Kardashian, with 68% agreeing that her posts don’t represent real life. Yet despite this she continues to be one of social media’s biggest draws, and has the sixth most-followed profile on Instagram. Most users like their celebrities and influencers to be a little more authentic: 64% agree that it’s refreshing when they’re honest with their posts.

Regular visitors to social media platforms set standards for honesty at different heights for different groups of posters. Dishonesty by influencers is seen as much more important (54%) than dishonesty from family members (35%), so we’re clearly more forgiving of people we know and love – or we expect less of them.

WeYouGove also observed those who explicitly seek payment for their products to higher standards. Overall, 28% of users have noticed this kind of influencer/celebrity marketing in the past month but almost half of them (49%) agree that these posts don’t represent the person making the endorsement.

The analysis says it’s worth noting, however, that this distrust is in line with perceptions of TV advertising among the same group – almost half (46%) don’t trust adverts on TV. And regardless of whether users believe the ads, the majority of those who notice them engage with them in some way.

You can download the whitepaper here.

B2B marketers failing to drive multi-channel campaigns

B2B marketers struggle to create and deliver multi-channel campaigns that successfully align with their marketing strategy.

This is despite an understanding that the ‘Integration Imperative’ is critical to achieving marketing goals, maximising exposure with target audiences and boosting return on investment.

That’s according to a survey by B2B agency Skout, which polled 100 senior UK marketing professionals and found that 63% feel they are not taking advantage of the different marketing channels available to them.

46% struggle to integrate channels, claiming that this is the biggest obstacle to successfully delivering their marketing activities.

Failure to create content that can actually be used across multiple channels was also identified as a challenge to successful integrated marketing.

40% of marketers don’t reuse content because they feel that it’s unsuitable for other formats, while 35% are concerned that content has lost its value after its initial use and don’t believe it can be used again.

32% blame ineffective campaign planning for not reusing content, suggesting that many marketers don’t fully consider their goals and objectives before developing content programmes.

Interestingly, 42% of marketers agree that using multiple marketing channels is the most important aspect of campaign integration. In comparison, 40% believe it’s the need for marketingand sales alignment and for 36% the imperative is good teamwork. Despite this, respondents admitted to not using content effectively.

For example, 85% of marketers think that case studies should be created for use across many channels for maximum impact. This could include video, podcast, website testimonials, long form PDFs and press stories all from one source. However, many felt these crucial content assets are significantly underutilised.

Reassuringly, 80% of marketing professionals agree that PR is a vital element of improving SEO and link building alongside building targeted brand awareness. 87% also agree that developing a PR programme can also improve social media performance.

However, 57% still struggle to integrate PR, social media, SEO and link building when planning and strategising. Over half of respondents understand the value of integrating channels – both online and offline – but many don’t know how to do it effectively, or feel that they can convey a consistent message across all outlets to achieve campaign goals.

97% of marketeers surveyed identified training, skills and budgets as the things holding them back from improved integrated marketing. Only 16% feel that they are equipped with sufficient training and skills, while just one in five believe that they have the adequate budget in place to support integrated marketing.

Claire Lamb, Director of Skout, said: “Clearly marketers realise the benefits of using multiple channels within their marketing programmes but many are struggling to integrate them effectively. If a business fails to communicate through all the correct channels to reach their audience they’re limiting the exposure of their content and brand. It’s also crucial to integrate Paid, Earned, Owned and Social media, so that they maximise their target audiences in more ways than one. If businesses don’t embrace and work across all channels together, their content won’t gain maximum reach, and they could miss out on new prospects.”

Image by rawpixel from Pixabay

The best times to send a marketing email? 10am & 1pm

The best times to send a marketing email are around 10am, shortly after people arrive at work and have their morning coffee, and 1pm, when people are catching up on emails after lunch.

That’s according to the latest quarterly report from GetResponse, which analyzed around 4 billion emails sent by its customers from January to June 2019, in 126 countries across 19 industries.

Similar to its previous reports, it has seen an increase in click-through rates later in the afternoon, around 6 PM when many people return home.

Other key findings include:

  • It’s become very clear that consumers in various locations show different levels of engagement when interacting with email marketing campaigns. Take Europe and North America for example. The difference in their average email open rate is 7.84 percentage points (26.84% vs 19%). For click-throughs it’s 1.37 percentage points (4.35% vs 2.98%). This may not seem like much at first, but given the fact that the average click-through rate (CTR) in North America is 2.98%, the difference of 1.37 percentage points accounts for +46% more clicks (if we ignore the sample size difference) for the campaigns sent by European marketers.
  • GDPR appears to have had minimal impact a year on. The strongest markets like Germany, France, or the Netherlands, still dominate the top of its table for CTR. Although France saw a loss of 1 percentage point in CTR, Germany observed an over 1.7 percentage point increase around the same time. Countries that were primarily unaffected by GDPR, e.g., Brazil, the US, and Canada, saw their average open rates and click-through rates drop (continuing the decline from last year.). GetResponse believes that’s because other regulations like the CCPA are making global consumers more aware of their rights – and why and how to unsubscribe.
  • In terms of industry engagement trends, restaurants and food, non-profits, and publishers are still on top. This suggests brands that send content about things we like and care about will always get the highest engagement. At the same time, legal services, agencies, and healthcare have seen a drop. This could be because of their campaigns – or the nature of the industry.
  • Want high open and click through rates? Send automated emails triggered by subscriber behaviour. GetResponse says it’s even worth doing for simple messages like RSS emails sent when you publish a new blog post. Newsletters and one-off emails still work. But triggered emails bring the best results.
  • When it comes to content, emails with video still generate the highest engagement rates. The problem is not all email clients support it, which is why only around 8% of the emails our customers send contain links to videos. For now, GetResponse says the best workaround is to use an image (maybe even a GIF) that looks like a video player and links to your page.

To read the full GetResponse Report, click here.

URLs cited as most important credibility factor for eCommerce sites

Online shopping ​accounts​ for almost 10% of total retail sales. With ​1% of websites infected​ by malware during any given week, these purchasing sites can post a threat to consumers.

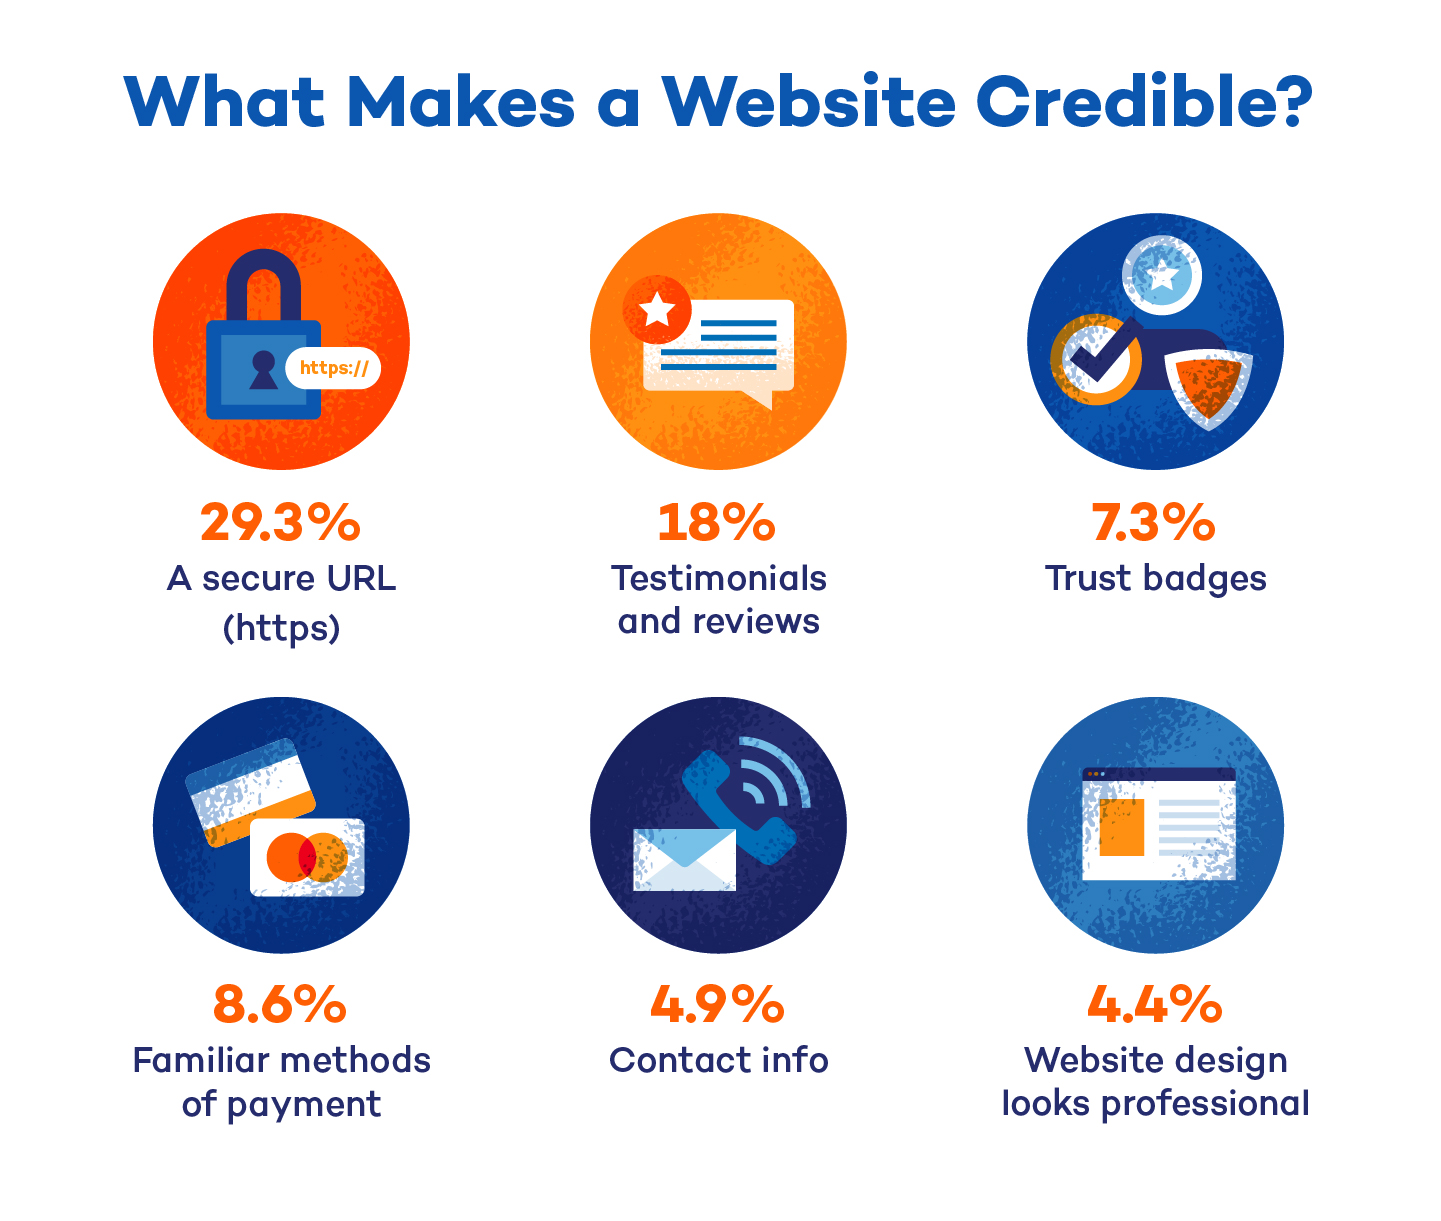
A ​study​ by ​Panda Security​ surveyed 1,000 Americans, asking them what the most important credibility factor is when making a purchase online.

The survey found that:

●  29.3% of respondents cited a ​secure URL (https)​ as the most important factor

●  18% of respondents cited a ​testimonials and reviews​ as the most important factor

●  8.6% of respondents cited ​familiar methods of payment ​as the most important factor

●  7.3 % of respondents cited ​trust badges​ as the most important factor

●  4.9% of respondents cited ​available contact info​ as the most important factor

●  4.4 % of respondents cited ​website design​ as the most important factor

Panda says that while an ecommerce site should have all of these credibility factors to keep it secure, it’s also important to note which ones consumer’s value. The top two factors were a secure URL (https) and testimonials and reviews, so be sure you have both on your site.

For more information on these credibility factors, read the full study ​here​.

Poor marketing to blame for eCommerce business failures

The majority of eCommerce startups are set to fail within their first 120 days of operation, with marketing deficiencies among the most common causes, new research has revealed.

A survey of 1,253 owners of failed startups in the UK, carried out by Marketingsignals.com, revealed the top ten reasons why e-commerce start-up businesses are failing.

According to sources (including Forbes and Huff Post), 90% of e-commerce startup businesses end in failure within the first 120 days. The Marketingsignals research found that the two main reasons for failure are poor online marketing performance coupled with an overall lack of search engine visibility.

Of those companies who were surveyed, a staggering 37% said that their failure could be attributed to an inability to compete or deliver online marketing, with 35% saying a lack of online visibility was the main factor.

Further research found that the same proportion of respondents (35%) felt failure was down to them being too small to compete or there being no market for their products/services, whilst 32% reported that it was due to them running out of cash.

Completing the top five reasons for failure were price and costing issues, with 29% of failed startup owners claiming this was the reason why they folded.

When further quizzed on the reasons why their online startup business failed, 23% said that it was due to being outcompeted, whilst 19% blamed retail giants such as Amazon for dominating a large share of the consumer online retail market.

16% felt that their business collapsed due to their lack of customer service, whilst 14% felt it was due to the poor team they’d built around themselves.

Completing the top ten reasons why e-commerce startups fail was product mistiming, with 11% of startup owners claiming that the reason why their business failed was due to ‘right product, wrong time’.

Gareth Hoyle, managing director at Marketingsignals, said: “It’s clear to see that having an online presence and being visible on search engines is a key area e-commerce startups need to focus on to ensure they succeed.

“As nine in ten online startups fail within their first 120 days of businesses, it’s incredibly important that business owners put provisions firmly in place well before launching – this must include a bulletproof search visibility and online marketing strategy, as well as ensuring there is a market for their product offering.

“A targeted, strategic approach to digital marketing is vital to the success of any online business in this day and age, only more so for small businesses who are just starting out. Many tools can be used to increase their brand awareness and search visibility in their first few days and weeks, where consumer trust and loyalty hasn’t yet been established.”

The top ten reasons why e-commerce startups end in failure:

  1. Poor online marketing – 37%
  1. Lack of online search visibility – 35%
  1. Little to no market for their products or services – 35%
  1. Running out of cash – 32%
  1. Price and costing issues – 29%
  1. Got outcompeted – 23%
  1. Retail giants dominating a large share of the market – 19%
  1. Lack customer service – 16%
  1. Poor team around them – 14%
  1. Product mistiming – 11%

Image by StockSnap from Pixabay

IPA Bellwether: UK marketing budgets flat-line

Hopes of a sustained revival were extinguished in the second quarter of 2019 as firms reported no change to available marketing budget expenditure amid growing political and economic uncertainty.

Following a return to growth in the opening quarter of the year, buoyed by firms taking a more pro-active approach to offset risks to their businesses, latest Bellwether data signalled a stalling of growth, with the net balance falling from +8.7% to +0.0%.

The 20% of panel members reporting greater marketing spend was completely offset by those cutting expenditure, while the remaining 60% kept budgets unchanged since Q1.

Growing economic uncertainty, continued ambiguity over Brexit and additional risk through a change of political leadership in the UK were mentioned by firms as factors expected to challenge the business environment over the coming year.

This created hesitancy among clients and delayed decision making. Panel members also raised concerns that difficult conditions domestically were damaging consumer confidence and impacting consumption.

Businesses were also wary of headwinds from external sources, particularly spillover effects into UK markets from global trade disputes and weaker growth at key export destinations such as Europe and Asia.

Nevertheless, marketing executives were given extra discretion over internet-based advertising in the second quarter, as signalled by a net balance of +11.5% of firms reporting budget growth (+17.2% in Q1). Within internet, search/SEO budgets also grew solidly (net balance of +9.9% from +14.2%).

Main media advertising budgets were also given a boost in the second quarter, as some firms used big ticket marketing campaigns to build brand recognition and expand customer bases. There were also suggestions that marketing was being deployed as a defensive strategy due to increased competitive pressures. Overall, a net balance of +5.6% of companies reported greater main media marketing budgets (+5.2% in Q1).

The only other Bellwether category to register growth in the second quarter was events. The net balance increased to +4.8%, from +3.4% previously, its highest since the first quarter of 2018 and corroborating with forecasts made earlier in the year that events budgets would grow over the 2019/20 financial year.

Meanwhile, available market research spend was reduced for a sixteenth successive quarter (net balance of -2.9% from -4.2%), while PR budgets were also cut (net balance of -5.2% from +0.0%). A second successive downward revision to sales promotion budgets was also recorded (-7.1% from -3.7%). Aside from the ‘other’ advertising category (net balance of -12.8% from -5.4%), it was direct marketing which was the worst performer, with the net balance falling to -9.0% (-3.5% previously), the lowest level in over ten years.

Panel members remained negative regarding financial prospects in the second quarter, casting more downbeat assessments towards both industry-wide and company-own finances than seen during the opening quarter of 2019.

With precisely 34% of marketing executives reporting a pessimistic outlook towards finances in their industry, compared to approximately 8% that were optimistic, the resulting net balance (-25.6%) signalled the second-most negative assessment since the fourth quarter of 2011 (surpassed only by the Q4 2018 reading of -28.6%). Furthermore, this was down from a net balance of -22.6% seen in Q1.

Latest data also pointed to deeper negativity towards own-company financial prospects. The net balance fell to -9.8%, from -2.7% in the first quarter, signalling the highest degree of pessimism since Q4 2011.

Bellwether remains cautious towards 2019, expecting only a modest 1.1% annual increase in adspend over the year as a whole. Various factors underpin its reservation, namely ongoing Brexit uncertainty, but also recent developments in the UK economy, which this year so far have largely been negative. It cites there is a real possibility that the UK economy will contract in the second quarter, and the Bellwether panel comments, as well as latest Bellwether data, highlight that businesses are looking to contain costs and shield against challenging demand conditions.

Nevertheless, Bellwether believes businesses will be eager to accelerate marketing efforts once uncertainty has cleared, and subsequently see 2020 onwards being more positive on the adspend front. It expects growth of 1.8% in 2020, followed by stronger rates of increase in 2021 (2.0%), 2022 (2.2%) and 2023 (3.1%).

Image by rawpixel from Pixabay

Brits falling victim to fraud via social media

Social media could be responsible for an increasing number of young Brits falling victim to fraud, new research has revealed.

Data shows that 47 per cent of payment scams in the last year were among under 30s, with over half (52 per cent) believing they have been approached by scammers on social media.

A massive 85 per cent have shared details on Instagram that could leave them open to ID theft, and a shocking six per cent say they would allow someone remote access to their bank account.

A further four in ten also say they would provide personal and security detail to somebody phoning up claiming to be from their bank.

In a bid to educate young Brits about scams and fraud Santander has teamed up with Kurupt FM from BAFTA-winning BBC TV show People Just Do Nothing to launch its latest fraud awareness campaign, ‘MC Grindah’s Deadliest Dupes’.

The three episode mini-series follows MC Grindah as he goes undercover to investigate the murky underbelly of scams and fraud and has been created to grab the attention of younger audiences online.

They will feature identity theft, online scams and money laundering as the focal topics, and are set to run across Instagram, Snapchat and YouTube to capture the key audience.

Susan Allen, Head of Retail & Business Banking, Santander UK, said: “We’re committed to fighting financial crime and work hard to raise awareness of fraud and scams with all age groups.

“We recognised that to engage younger audiences with these important messages, we needed to do something different and memorable.

“We hope that everyone, no matter what age, will enjoy Deadliest Dupes and learn how to stay safe so they Don’t Get Kurupted.”

Deadliest Dupes follows previous fraud awareness campaigns run by Santander including its Phish & Chips van which toured the UK handing out free fish and chips and a side portion of advice on avoiding scams.

A Scam Avoidance School introduced in branches in 2018 has been attended by over 100,000 people to date.

A new online hub has been set up to support the campaign.

Those at risk can find out more about the tricks used by online fraudsters and test their own ‘scam smarts’ with a specially designed quiz.