Digital Marketing Solutions Summit | Forum Events Digital Marketing Solutions Summit | Forum Events Digital Marketing Solutions Summit | Forum Events Digital Marketing Solutions Summit | Forum Events Digital Marketing Solutions Summit | Forum Events

Posts Tagged :

Social Media

Top social marketing for 20223 revealed

In 2023, businesses that take a social-first approach to their brand and customer care strategy will be the ones to reap the benefits. Stronger brand reputation, greater customer interaction, trust and loyalty – now and in the future – depends on it.

That’s the conclusion of Hootsuite’s 7th Annual Social Trends Report, leveraging surveys from over 10,600 marketers and primary interviews with social marketing practitioners, leaders, observers and partners.

Here are the top insights for marketers to consider in the year to come:

  • Big brands are investing less in influencer marketing, opening the door for small businesses to engage top creators (at lower price points!)
  • Social’s newfound exposure in the C-suite opens it up to new levels of scrutiny – with differing opinions on what ROI looks like among social marketers and senior leaders
  • Recycling content becomes a thing of the past; marketers stop chasing new features and start getting more strategic, creating more creative, unique content for fewer platforms
  • Social commerce loses traction with platform pull back, but is only a loss to those that follow suit; marketers with the patience to hold on see new opportunities to gain a competitive edge
  • Google, who? Social search optimization emerges as a make-or-break skill for marketers
  • The return to brick-and-mortar shopping makes businesses lose focus on digital customer service – opening the door for chatbot adopters to gain a massive advantage
  • Marketers don’t feel equipped for digital customer service, and the implications of unanswered DMs are further reaching than one might think

At the time that last year’s Social Trends Report was released, pandemic restrictions were starting to ease and markets were booming – a positive turn of events that had many feeling optimistic for the future. However, looking ahead into 2023, a looming recession, rising inflation, declining consumer spending, and workforce reductions across major business sectors have made decision making precarious for businesses of all sizes. Despite this uncertainty, Hootsuite’s report shows that there is good news on the horizon.

Social marketers are experiencing a defining moment in history for the industry. After decades of advocating for social to have a seat at the boardroom table, it’s finally happening – social marketers are getting more agency over their work, and social media marketing has matured as a profession.

“Social media has never played a more central role to businesses. As businesses continue to look for ways to future-proof operations and connect with today’s tech-savvy customers, social media and digital marketing will inevitably play a part in nearly every business strategy,” said Maggie Lower, Chief Marketing Officer, Hootsuite. “In 2023, businesses that take a social-first approach to their brand and customer care strategy will be the ones to reap the benefits. Stronger brand reputation, greater customer interaction, trust and loyalty – now and in the future – depends on it.”

Social has become intrinsically intertwined with how people live, work, operate, and shop — with more than 4.7 billion people around the globe now using social media. While keeping up with all the evolving trends can be intimidating, Hootsuite’s Social Trends Report offers marketers a guide to the wild world of social — complete with simple, specific recommendations — to help them gain an edge on their social strategy in 2023 and build community and connection with their customers.

“In a year marked by global economic and social upheaval, brands and organizations are looking for tools to help navigate their business through the noise to connect with their customers — and with even more urgency as we all become more digital and connected,” said Tom Keiser, Chief Executive Officer, Hootsuite. “With the launch of our 2023 Trends Report, we’re proud to provide our insights, recommendations and tangible recommendations to help organizations not only successfully navigate the digital wilderness, but also adapt to new buyer trends, find new ways to support their customers, and identify new paths for growth.”

To help our customers put the top social trends into action in real-time, we have paired each trend within the report with newly-created resources that social media marketers can build into their strategy and begin using today. The suite of resources developed to support this report (available for download at the links below) include:

Download the full report.

Worldwide social media ad spend up 19% YoY

The new report has highlighted a rebound in median monthly global ad spend compared to the same period last year, a decrease in the median monthly click-through rate (CTR), a slight uptick in median monthly cost-per-click (CPC), and steady engagement on Facebook and Instagram.

The data, from Emplifi‘s Q2 2022 analysis of social media spend across thousands of brands worldwide, also shows a slight decrease in brands’ response rate to customers who ask questions on social media.

Brands increase investment in paid social media

After seeing a notable post-holiday drop in Q1 2022, median global monthly ad spend among brands rebounded by 18% in Q2 2022, climbing back above USD 4,200 – a figure close to the year-high level that was seen in Q4 2021. With this quarter’s rebound, median monthly ad spend has increased 19% YoY, suggesting that brands are allocating more budget to reach their target audiences via paid social.

Click-through rate (CTR) continues to decline

Emplifi data shows that median monthly CTR has been steadily decreasing over time, dipping below the 1% mark in Q1 2022. This past quarter tells a similar story, with CTR lowering to 0.93%, signaling a 11% drop YoY. Despite this decrease, businesses can continue to depend on social media advertising to return value, as engagement remains fairly stable when consumers interact with paid social posts.

Median cost-per-click (CPC) remains stable

While CTR has steadily decreased, Emplifi data shows that CPC remains relatively stable despite some fluctuations in recent quarters, hitting $0.20 in Q2 2022. With average CPC rebounding this quarter after seeing a drop at the beginning of the year, it will be interesting to see whether this is a quarterly fluctuation or the start of an upward trend.

Instagram still dominant in engagement

After seeing a steady decrease since Q2 2021, median Facebook post interactions saw a slight bump quarter-over-quarter, reaching their highest level since Q3 2021. However, Q2 2022 levels remain notably lower than Q2 2021, with brands generating approximately 5.2 interactions per 1K impressions on Facebook, a 15% decrease year-over-year. When it comes to industries, the strongest performers for engagement on Facebook were brands in the Industrial (9.79) and Accommodation (9.04) sectors, while the lowest performers were Ecommerce (2.80), Retail (3.64), and Fashion (3.90).

Instagram continues to show much stronger engagement than Facebook, with about 32 interactions per 1K impressions in Q2 2022, which is on par with what has been seen across the past year. Brands in the Beverages (47.37), Alcohol (46.83), and Software (45.11) sectors saw the highest levels of engagement, with Retail (17.71), Telecom (21.58), and Ecommerce (22.81) brands lagging.

TikTok versus Instagram

In an analysis of sister TikTok and Instagram accounts across 330 brands from January-June 2022, Emplifi data shows that brands post more often on Instagram (68%) than on TikTok (32%) in relative posting frequency. While reach and interactions were higher on Instagram, video content had greater engagement on TikTok. Either way, both platforms have shown an upward trend over six months in terms of engagement rate, peaking in June 2022, reconfirming user interest for engaging video content.

Twitter shows the fastest response times to questions

Emplifi data shows that median response rates for brands answering questions on Facebook and Instagram decreased slightly in Q2 2022. On Twitter, after some mild fluctuations, response rates have returned to a similar level from the same time last year. When looking at engagement by industry, Beauty, FMCG Food, and Home & Living brands had comparatively higher response rates to user questions on social, while Automotive brands had lower response rates across all three social media platforms.

In terms of the time it took for brands to respond to questions, Instagram and Twitter saw slight bumps quarter-over-quarter, while Facebook saw a decrease for the second straight quarter. Examining the data by industry, some brands have the slowest response times on Facebook (alcohol, beauty, FMCG food, home & living, service), while for other brands, it’s on Instagram (automotive, ecommerce, electronics, fashion, retail). However, except for one industry (FMCG food), Twitter typically sees the fastest response times among the three networks examined.

“Brands need to connect with their audiences where they are and social media is an integral part of the marketing mix,” said Emplifi CMO, Zarnaz Arlia. “It’s no secret that TikTok’s surge in popularity is continuing – we’ve found that brands post more often on Instagram than TikTok, and video content has higher engagement on TikTok. It will be interesting to see how this trends in the months ahead. What is certain though is that in today’s world, having and maintaining a solid presence on both TikTok and Instagram is essential.”

Emplifi’s analysis is based on Q2 2022 data and year-on-year comparisons downloaded at the beginning of July 2022. You can read the findings here.

Do you specialise in Social Media? We want to hear from you!

Each month on Digital Marketing Briefing we’re shining the spotlight on different parts of the print and marketing sectors – and in May we’ll be focussing on Social Media solutions. It’s all part of our ‘Recommended’ editorial feature, designed to help marketing industry professionals find the best products and services available today. So, if you specialise in Social Media and would like to be included as part of this exciting new shop window, we’d love to hear from you – for more info, contact Clair Wyld on c.wyld@forumevents.co.uk. Here’s our features list in full:- May – Social Media Jun – Brand Monitoring July – Web Analytics Aug – Conversion Rate Optimisation Sept – Digital Signage Oct – Brochure Printing Nov – Creative & Design Dec – Online Strategy

Emerging video app Tiki wants to be the powerhouse for upcoming stars

Obtaining millions of views in less than a month is not just a dream. That’s what one can achieve on an emerging social platform named Tiki now being launched in the Middle East by DOL Technology.

Under its latest #TikiTalent campaign, more than 33.3M views have been reached and the number doesn’t cease to grow. Among diverse sub-tags covering sports, lifestyle, photography, food, music, etc., the most viewed one is #DancingStar with 2.2M views.

Behind the rising creator economy are the booming social media platforms in this region. For instance, Saudi Arabia leads an exponential annual growth of 8.7% in the social media industry and plans to embrace more opportunities with the ambitious Saudi Vision 2030 Program.

In a region swarming with social platforms, it’s fair to ask why it’s worth trying Tiki. Here’s what the company says are its USPs:

  • Creator-first Platform

As a place for real talents and future stars, Tiki endeavors to allow every user to cultivate their gifts and talents to be the expert and realize their dream. No talented person will be disregarded in Tiki. Creator-first approach by focusing on creator development, content coaching, co-marketing, community building, and talent monetizing.

  • Entertaining, Localized & Authentic Content

Tiki is dedicated to providing localized supports for local talents from different backgrounds. It’s respectful to local cultures and proud to give local content an exclusive stage. Tiki’s brand values are spreading happiness, sharing knowledge, telling inspiring stories, and moving to the rhythm.

  • Community Value

Creators can build their fan base from ground zero, and fans can send direct supports and get in real touch with their favorite creators. Tiki spares no efforts to foster the connections for you by exciting functions like Leaderboard, Future Star, and endless campaigns like #TikiTalent.

“We’re starting a movement to empower creators to showcase their talents to their community and achieve fame from their passions and talents. It’s a place for real talents to pursue their own idea of success,” said Ian Goh, Operations Director of Tiki MENA.

Tiki doesn’t want to be seen as just another short video app – it described itself as a “glocalized” platform redefining the standard for short video creation and sharing.

Developed by Singapore-based DOL Technology and launched in 2021, Tiki has 16 million monthly active users.

https://tiki.video/

Do you specialise in Social Media marketing? We want to hear from you!

Each month on Digital Marketing Briefing we’re shining the spotlight on different parts of the print and marketing sectors – and in May we’ll be focussing on Social Media services.

It’s all part of our ‘Recommended’ editorial feature, designed to help marketing industry professionals find the best products and services available today.

So, if you specialise in Social Media solutions and would like to be included as part of this exciting new shop window, we’d love to hear from you – for more info, contact Clair Wyld on c.wyld@forumevents.co.uk.

Here are the areas we’ll be covering, month by month:

May – Social Media
Jun – Brand Monitoring
Jul -Web Analytics
Aug -Conversion Rate Optimisation
Sep -Digital Signage
Oct -Brochure Printing
Nov – Creative & Design
Dec – Online Strategy

British TV Presenters ‘Earning up to £15K Per Instagram Post’

Holly Willoughby, Ant & Dec and Stacey Solomon lead a list of the leading Instagram earners working on UK TV, with fees topping out at nearly £15,000 per post.

The insight comes after GamblingDeals.com identified the top British TV presenters by researching the biggest and trending UK TV shows, with only British TV presenters who present and/or reside in the UK chosen. They then used Influencer Marketing Hub’s Sponsored Post Money Calculator to calculate the maximum potential earnings of each account per sponsored post.

In first place is Holly Willoughby, with the potential to earn £14,174.16 per sponsored post on Instagram. As one of daytime TV’s best-dressed presenters, her sense of style and kind-natured approach apparently sits well with 6.9 million Instagram fans and could help to earn her a little extra on top of her handsome salary.

Britain’s well-loved Geordie duo Ant & Dec claim second place. As the faces of I’m a Celebrity Get me Out of Here!, Britain’s Got Talent and more, the entertainers could rake in up to £8,507.73 per post on Instagram.

Once famous from The X-Factor but now a staple in daytime TV, cheery Stacey Solomon claims third place. Her uplifting Instagram posts with partner in crime Joe Swash and their newborn could earn her a hefty £7,850.15 if they were sponsored.

In fourth place is adventurer-turned-TV-presenter Bear Grylls with the earning potential of £7,652.26 per post, followed by radio and TV broadcaster Fearne Cotton in fifth – with a new podcast to plug and a focus on mental wellbeing, positive engagements with her fans could earn her an impressive £6,643.56 extra per collaboration.

Completing the top ten earners on Instagram are:

  • Phillip Schofield – up to £6,568.87 per post
  • Jeremy Clarkson – up to £6,274.73 per post
  • Rochelle Humes – up to £4,264.26 per post
  • Mark Wright – up to £3,634.40 per post
  • Emma Willis – up to £3,572.03 per post

All earnings are estimates only. Data was calculated on 30/10/20 and accurate as of then.

The top 20 earning TV presenters

TV presenterInstagram (@)Number of Instagram followersEstimated potential earnings per post (£)
1Holly Willoughbyhollywilloughby6.9m14,174.16
2Ant & Decantanddec4.1m8,507.73
3Stacey Solomonstaceysolomon3.8m7,850.15
4Bear Gryllsbeargrylls3.7m7,652.26
5Fearne Cottonfearnecotton3.2m6,643.56
6Phillip Schofieldschofe3.2m6,568.87
7Jeremy Clarksonjeremyclarkson13m6,274.73
8Rochelle Humesrochellehumes2m4,264.26
9Mark Wrightwrighty_1.7m3,634.40
10Emma Willisemmawillisofficial1.7m3,572.03
11Paddy McGuinnessmcguinness.paddy1.7m3,554.32
12Joe Swashrealjoeswashy1.6m3,449.60
13Katie Piperkatiepiper_983,0003,009.16
14Ruth Langsfordruthlangsford969,0002,968.35
15Rylan Clark-Nealrylan1.4m2,929.85
16Kate Garrawaykategarraway952,0002,918.30
17Stacey Dooleysjdooley918,0002,811.27
18Nick Grimshawnicholasgrimshaw1.3m2,799.72
19Piers Morganpiersmorgan1.2m2,620.31
20Davina McCalldavinamccall1.2m2,544.85
SNP-Social

Do you specialise in Social Media Content & Strategy? We want to hear from you!

Each month on Digital Marketing Briefing we’re shining the spotlight on different parts of the print and marketing sectors – and in May we’ll be focussing on Social Media Content & Strategy.

It’s all part of our ‘Recommended’ editorial feature, designed to help marketing industry professionals find the best products and services available today.

So, if you specialise in Social Media Content & Strategy solutions and would like to be included as part of this exciting new shop window, we’d love to hear from you – for more info, contact James Howe on j.howe@forumevents.co.uk.

Here are the areas we’ll be covering, month by month:

May – Social Media
Jun – Brand Monitoring
Jul – Web Analytics
Aug – Conversion Rate Optimisation
Sep – Digital Signage
Oct – Brochure Printing
Nov – Creative & Design
Dec – Online Strategy

Instagram ‘attracting a larger audience than Facebook’ among brands

Instagram has a larger audience and nearly 20X more interactions than Facebook among top 50 brand profiles, according to Socialbakers’ new Q4 2019 Trends Report.

Key insights from the report include Instagram overtaking Facebook in audience size, the relative decline in engagement during the holiday season, the popularity of vertical videos, the dominance of women among fans and followers, growing ad spend, and the continuing explosion of influencer marketing. 

“The writing has been on the wall for some time, but now it’s official. When it comes to the top 50 biggest brand profiles, Instagram has a larger audience than Facebook,” said Yuval Ben-Itzhak CEO, Socialbakers. “That development was not a surprise. What was unexpected in Q4 2019, however, was the relative decline in engagement during the holiday season. This is a warning sign that brands require a deeper understanding of which types of content their audiences find compelling, and an agile method to get that content in front of them.”

The key findings of the Q4 2019 Trends report include:

·         For the first time globally, Instagram surpassed Facebook in audience size – but for the top UK brand profiles, Facebook still has a marginally bigger audience, but greater engagement is found on Instagram

·         Despite efforts to attract consumers during the holiday period, post interactions for both Instagram and Facebook were lower in Q4 2019 than Q4 2018

·         Women make up the majority of fans and followers of brand pages on Instagram and Facebook, representing over half (56.4%) of the audience engaging with brands

·         Whilst 70% of videos on Facebook brand pages are shot horizontally, viewers are more likely to complete a vertical video than horizontal (29.9% vs. 22.2% respectively)

·         Ad spend on Instagram Stories increased by 40% over the last year, and by 91% over the last two years. Meanwhile, in the UK, brands are still posting more to the Instagram News Feed

·         The number of influencers using #Ad exploded by 90.5% in Q4 2019

·         The Services category (including lawyers, accounting services and IT services) found a 66.7% jump in engagement

Based on the top 50 biggest brand profiles worldwide, there was a notable change in Q4 2019. For the first time, the total audience on Instagram surpassed the total audience size on Facebook. Additionally, the total interactions on Instagram were nearly 20 times larger than those on Facebook. So, even though the top 50 brands published more posts on Facebook, the engagement on those posts didn’t reach the numbers that Instagram was able to achieve.

For the top UK brand profiles Facebook still has a marginally bigger audience. However, while brands are posting roughly the same amount of content to Facebook and Instagram, they are seeing significantly more engagement on Instagram. The lesson here is that UK brands need to focus on their Instagram strategy as by splitting their content between both platforms they are likely leaving interactions on the table. 

Engagement: A surprising drop in interactions

In the UK the industries that are seeing the most engagement across Facebook and Instagram are ecommerce, fashion and retail. The data shows that ecommerce brands are really leveraging the potential of Facebook, whilst Fashion brands are running the show on Instagram. 

Despite attempts to attract consumers during the holiday season, the relative post interactions for both Instagram and Facebook were lower in Q4 2019 than a year ago. This was true even among the most successful industries on social media. Fashion, the top industry on Instagram, decreased by 19.4%, while the top industry on Facebook, Ecommerce, decreased by 9.6% versus Q3 2019. This may indicate that brands need to get smarter about the content they post, and focus on top quality content in smaller volumes to increase engagement.

However, one interesting success story in Q4 engagement is the Services category. It achieved a 66.7% jump in engagement on Instagram compared to Q3 2019. On Facebook, Services finished fourth with 7.6% of total interactions after not making the top eight in the previous quarter. Services is a wide-ranging category that includes lawyers, accounting services, hairdressers, car repairs, IT services, conference and event organisers, and weight loss courses.

Format: Vertical videos pull viewers in

Marketers often wonder whether viewers prefer videos that were shot horizontally or those that were shot vertically. Currently, about 70% of videos on Facebook brand pages are shot horizontally. But according to Q4 data from those Facebook brand pages, vertical videos perform better than horizontal videos across the board. For videos shorter than 30 seconds (which is the most popular video length), vertical videos were completed by viewers 29.9% of the time, while horizontal videos were completed 22.2% of the time. 

Demographics: Women are dominant on social media

According to the Q4 2019 data, women make up the majority of fans and followers of brand pages on both Instagram and Facebook. On Instagram, 58% of brand page followers were female, comprising the majority of every age demographic. On Facebook, women made up 56.7% of the total audience of page fans, although there were slightly more men in the 18-24 age demographic. Women are also the largest group of people mentioning and interacting with brand pages in the prime marketing demographic of 25-34. Overall, women represented 56.4% of the audience engaging with brands in Q4 2019.

Ad spend: Instagram rises but Facebook remains the leader

As in past quarters, ad spend on Instagram Stories continues its rapid growth, although Facebook Feed remains the leader with 58.3% of total ad spend. For the first time, Instagram Stories reached 10% of ad spend in the second half of 2019. Overall, the spend on Instagram Stories increased by 40% over the last year, and by 91% over the last two years.

In the UK the data shows that brands are still posting more to the News Feed. Since Stories are proving to be a highly engaging content format globally, perhaps UK brands need to up their game on Stories. 

Other ad spend trends include the rise of Instagram Explore and Facebook Marketplace as a destination for advertising dollars. In its first five months, the percentage of ad spend on Instagram Explore grew to 1.32%. And over the last year, ad spend on Facebook Marketplace grew from 0.72% in December 2018 to 1.31% at the end of 2019, an increase of more than 80%.

Influencer marketing: No sign of slowing down

One trend that remains unchanged is the skyrocketing growth of influencer marketing. In Q4 2019, the number of influencers using #Ad or the local language version in their posts exploded by 90.5%. For the third straight quarter, the top Instagram brand profile in the world associated with influencers was Walmart, which had 854 mentions from 619 influencers in Q4 2019. Other profiles with successful influencer partnerships included Daniel Wellington, iDeal Of Sweden, and FashionNova.com.

The complete Q4 2019 Social Media Trends Report with supporting graphics is now available for free download.

Using Facebook for marketing success

By Strange

What’s the main focus of your digital marketing strategy? At one time, everyone would have said Google. These days, however, Facebook has become a credible alternative for many businesses. As an agency, we’ve developed considerable resources and capabilities to service the huge growth in clients’ use of the platform.

You may already appreciate the sophisticated features and capabilities combined with enormous reach and powerful targeting that Facebook offers. These can deliver great returns for almost any brand or organisation, whether used for acquisition, awareness or direct response, for example.

Being a Facebook Marketing Partner certainly helps us deliver better value for clients. Facebook defines Marketing Partners as “tech companies and agencies that have been vetted by Facebook and certified for their excellence in helping advertisers get the most from their campaigns.” 

New insights on the Facebook Auction 

As a Marketing Partner, we can access information and insights from Facebook that may not be widely available. In this article we’re sharing some valuable information we were recently given on the Facebook Ad Auction. We hope this helps make the auction process work better for you.

The Facebook Auction is the process by which Facebook’s algorithms spend advertising budgets in the most effective way possible. How these auctions work has, for a long time, been somewhat opaque, but Facebook has now started to release more information about how the system works.

1. Simplify your campaign structure 

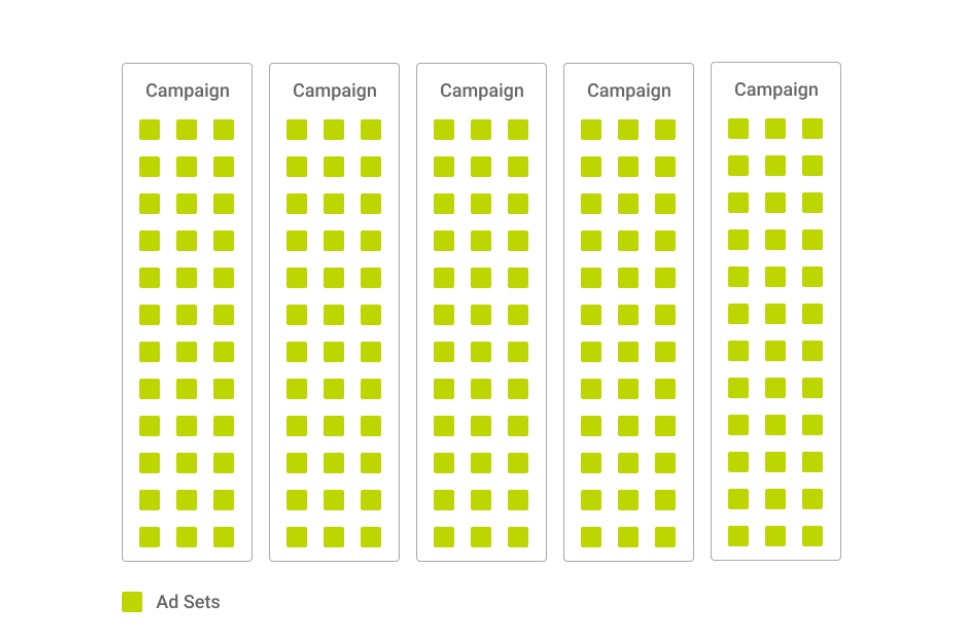
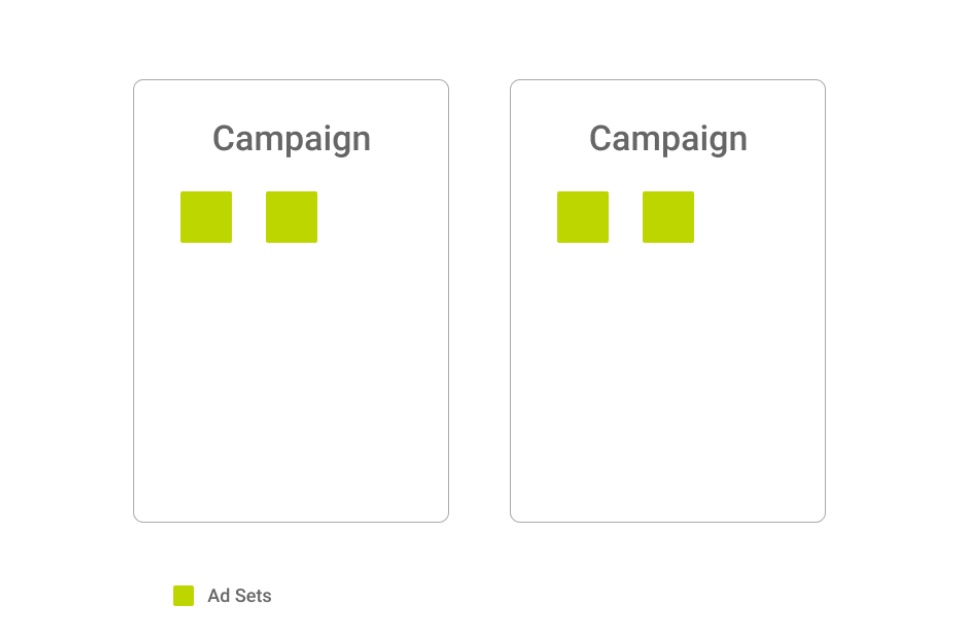
A typical Facebook account structure looks something like this. It can have multiple campaigns organised into different marketing approaches, strategies or tactics. Campaigns are subdivided by highly defined, narrow audiences at ad set level.

But if your account structure could look like the one below, Facebook claims that a simplified and consolidated structure leads to what they call increased ‘auction signal’, i.e. it increases the available signals Facebook’s algorithm has to work with when it decides where and how to deploy budget. 

Combining your campaigns and ad sets into larger buckets helps because it removes constraints on the system so that it can search for the best areas of opportunity within larger groups of people, instead of being restricted to granular, pre-defined audiences.

The primary benefit of a consolidated account structure, however, is that it will help drive a faster exit from Facebook’s ‘learning phase’ because the algorithm has more information to work with.

2. Respect the learning phase

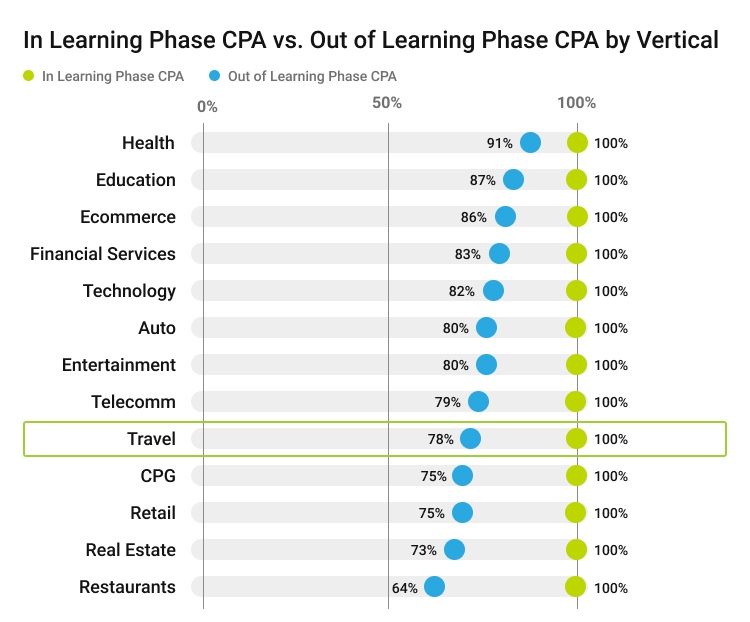
Facebook’s learning phase is when the delivery system explores the best way to deliver your ad sets after launch. This means that performance is less stable, and CPAs will actually be worse during this time because the engine is still working out the best people and places to show the ad. Anything that you can do to exit the learning phase earlier will therefore help to improve overall campaign performance. 

Fortunately there are some straightforward rules you can follow to make sure your campaigns have enough data to exit the learning phase in a timely manner. For instance, making sure that your targeting and placements aren’t too narrow will really help give the auction more signal. 

It’s also very important that you optimise for the right conversion event. If you’re optimising for a conversion event which is too far along the funnel for you to reach a sufficient number of conversions, try switching to something which will record more conversions – for example, optimising for ‘Add to Carts’ instead of ‘Purchases’. A higher number of conversion events will ultimately help you get past the learning phase threshold and improve overall optimisation.

One last critical piece of advice: do your best to avoid frequent manual edits! Whilst it may be tempting to constantly tune and tweak your campaigns, making significant changes can reset the learning phase so that the algorithm has to start all over again. Any changes to the following can cause your campaigns to re-enter the learning phase:

  • Targeting
  • Placements
  • Creative (including adding additional ads)
  • Optimisation events
  • Pausing your ad set for more than 7 days
  • Bid strategy
  • Budgets

Key takeaways

  1. Consolidate your account structure for maximum auction signal
  2. Give the Facebook system as many data points as possible so that it can exit the learning phase quickly
  3. Don’t narrow your targeting too much and optimise for the right conversion events to reach the learning phase threshold
  4. Avoid frequent manual edits so that your campaigns don’t re-enter the learning phase

Continuing to evolve

Facebook has come a long way since its Marketplace was originally launched in 2007. Back then we were helping clients use the brand new channel (we’re now celebrating our 20th anniversary as an agency) and we’ve been keeping abreast of Facebook’s evolution ever since.

Future changes are inevitable. However the platform shapes itself in the future our focus as an agency will always be on working in partnership with Facebook to bring greater value to our clients.

Read more about Strange here

UK public ‘doesn’t trust social media’ or influencers

Rightly or wrongly, Brits don’t always trust what they see on their favourite social platforms.

That’s according to data from YouGov, which indicates 41% of regular users claim to have seen inaccurate content over the last month, while nearly a fifth of (17%) mainstream social media users go even further and say they’ve seen completely false content.

What’s more, 21% of users say they’ve come across content they consider to be misleading, 20% say they’ve come across misinformed content, and 19% say they’ve seen content that’s been manipulated or distorted.

Typically, the younger a user is, the more likely he or she is to have noticed information that is misleading. Are older people more likely to take social posts at face value?

Moreover, no single group of users is considered completely authentic: only 25% of regular users say that the profiles of their family give a ‘very honest’ portrayal – and friends, colleagues, celebrities and influencers perform even worse.

Almost half of users (48%) believe that the profiles of celebrities are either ‘not at all’ or ‘somewhat dishonest’, with only 22% believing that the reverse is true (‘honest’ or ‘very honest’ portrayals).

In addition, regular users of social networks are sceptical of ‘super-influencer’ Kim Kardashian, with 68% agreeing that her posts don’t represent real life. Yet despite this she continues to be one of social media’s biggest draws, and has the sixth most-followed profile on Instagram. Most users like their celebrities and influencers to be a little more authentic: 64% agree that it’s refreshing when they’re honest with their posts.

Regular visitors to social media platforms set standards for honesty at different heights for different groups of posters. Dishonesty by influencers is seen as much more important (54%) than dishonesty from family members (35%), so we’re clearly more forgiving of people we know and love – or we expect less of them.

WeYouGove also observed those who explicitly seek payment for their products to higher standards. Overall, 28% of users have noticed this kind of influencer/celebrity marketing in the past month but almost half of them (49%) agree that these posts don’t represent the person making the endorsement.

The analysis says it’s worth noting, however, that this distrust is in line with perceptions of TV advertising among the same group – almost half (46%) don’t trust adverts on TV. And regardless of whether users believe the ads, the majority of those who notice them engage with them in some way.

You can download the whitepaper here.